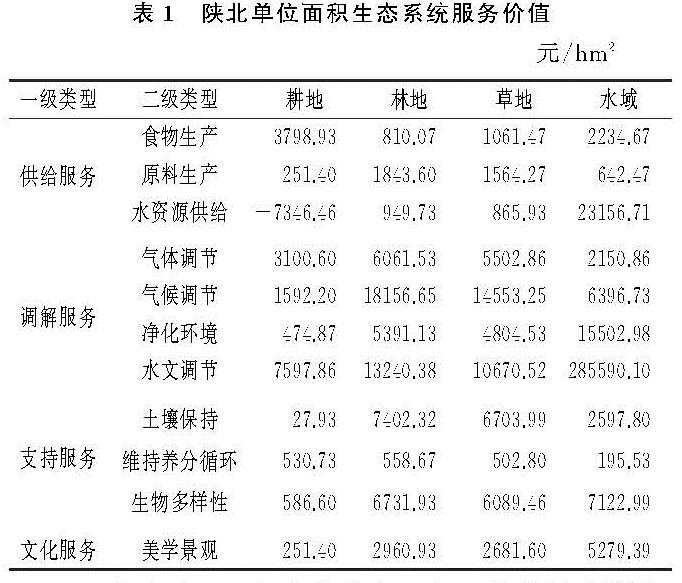
2.1 研究区生态系统服务供给时空分异
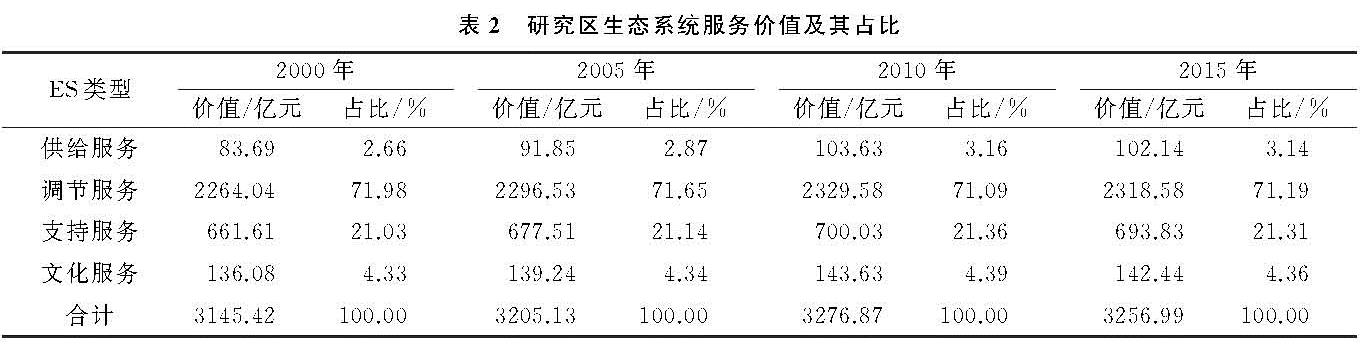
2000—2015年,陕北黄土高原4类服务总量在增加,且调节服务所占比例最大。从表2中可以看出:2010年4类服务及其总量达到最大,尽管2015年有所减少,但与2000年相比,各类服务及其总量均有较大增加。同时,4类服务虽然在4个年份中所占的比例有所变化,但调节服务所占比例均超过了70%,且从大到小的顺序没有改变,即保持调节服务、支持服务、文化服务和供给服务的次序。
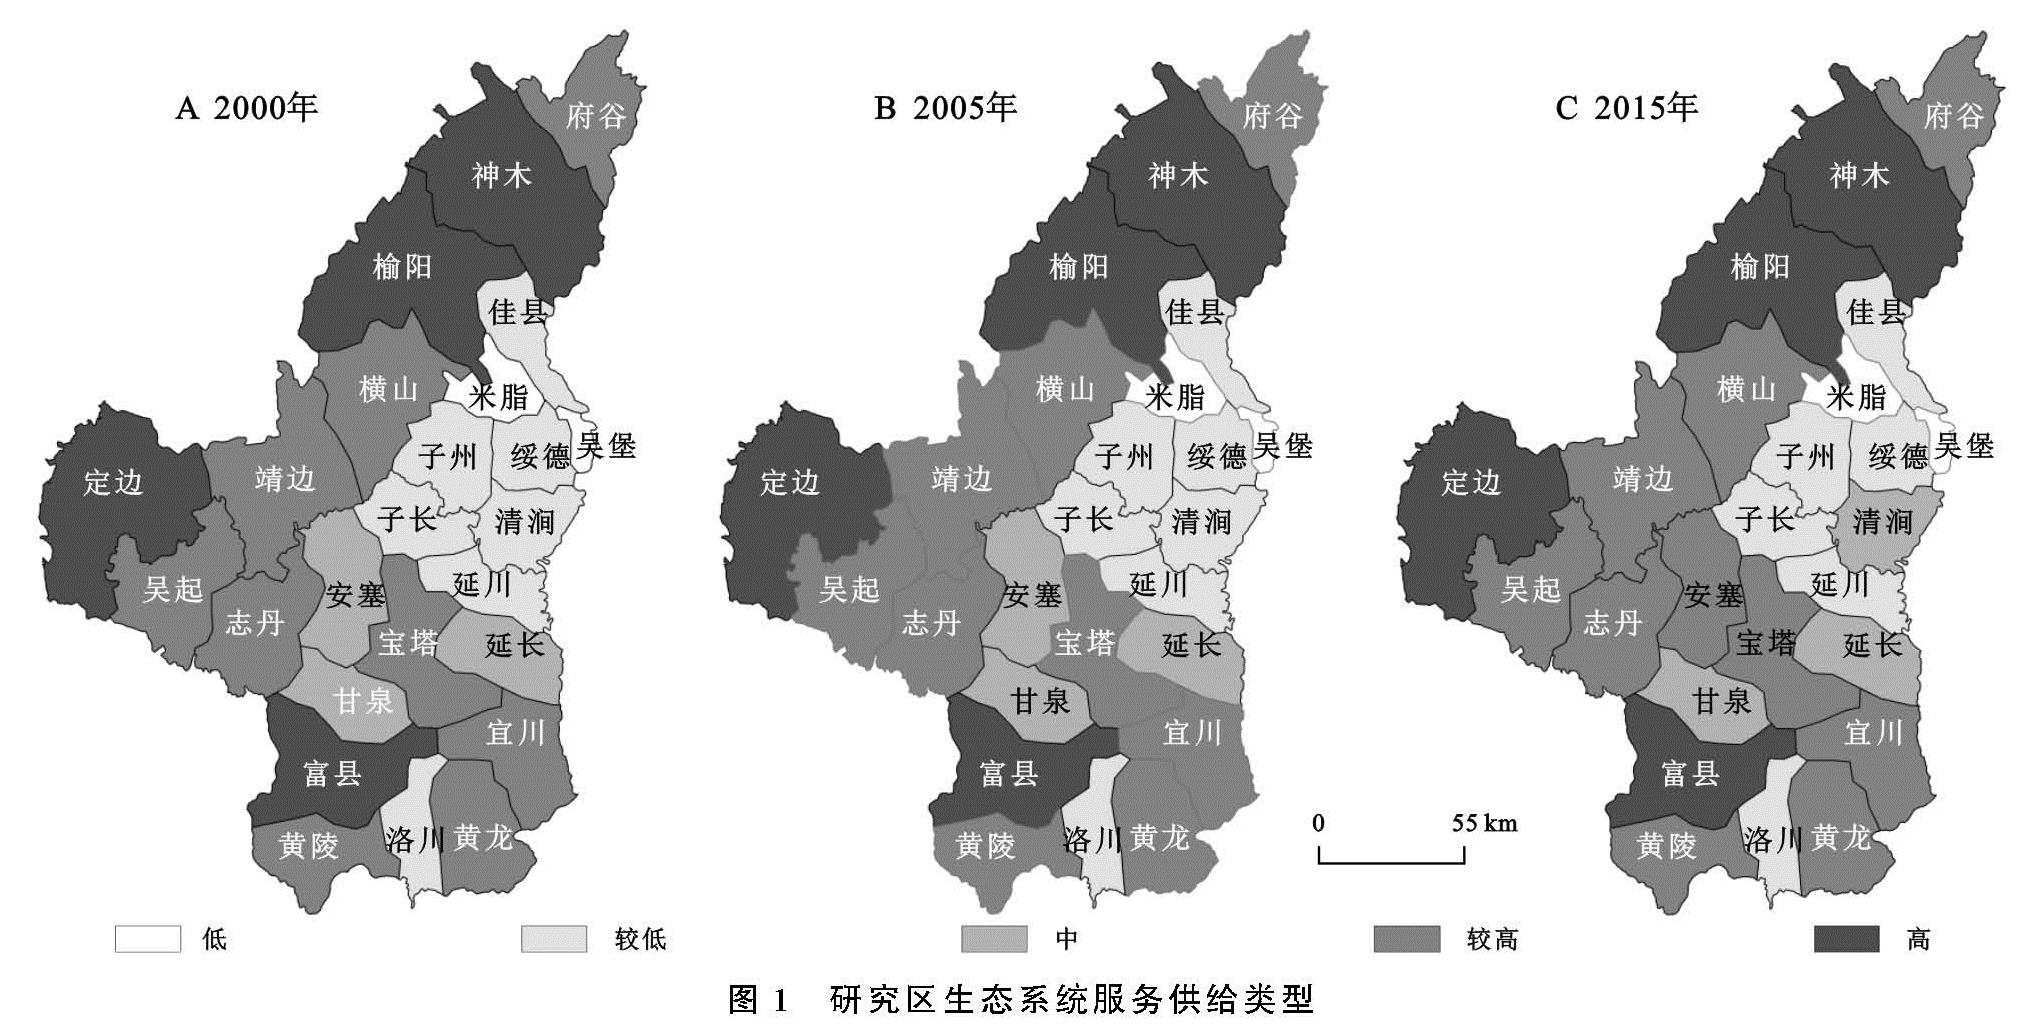
2000—2015年陕北黄土高原ES供给价值的整体格局大体保持不变。为便于分析,本文依照自然断点法对上述年份进行类型划分,可将ES划分为5种类型:低、较低、中、较高和高(图1)。由图1可知,2000—2015年陕北黄土高原ES供给的整体格局为:高值区主要分布在研究区北部,西部和南部有零星分布,中值区主要集中在研究区中部,较低值区主要集中在研究区的中东部,低值区则零星分布在研究区中部偏北。
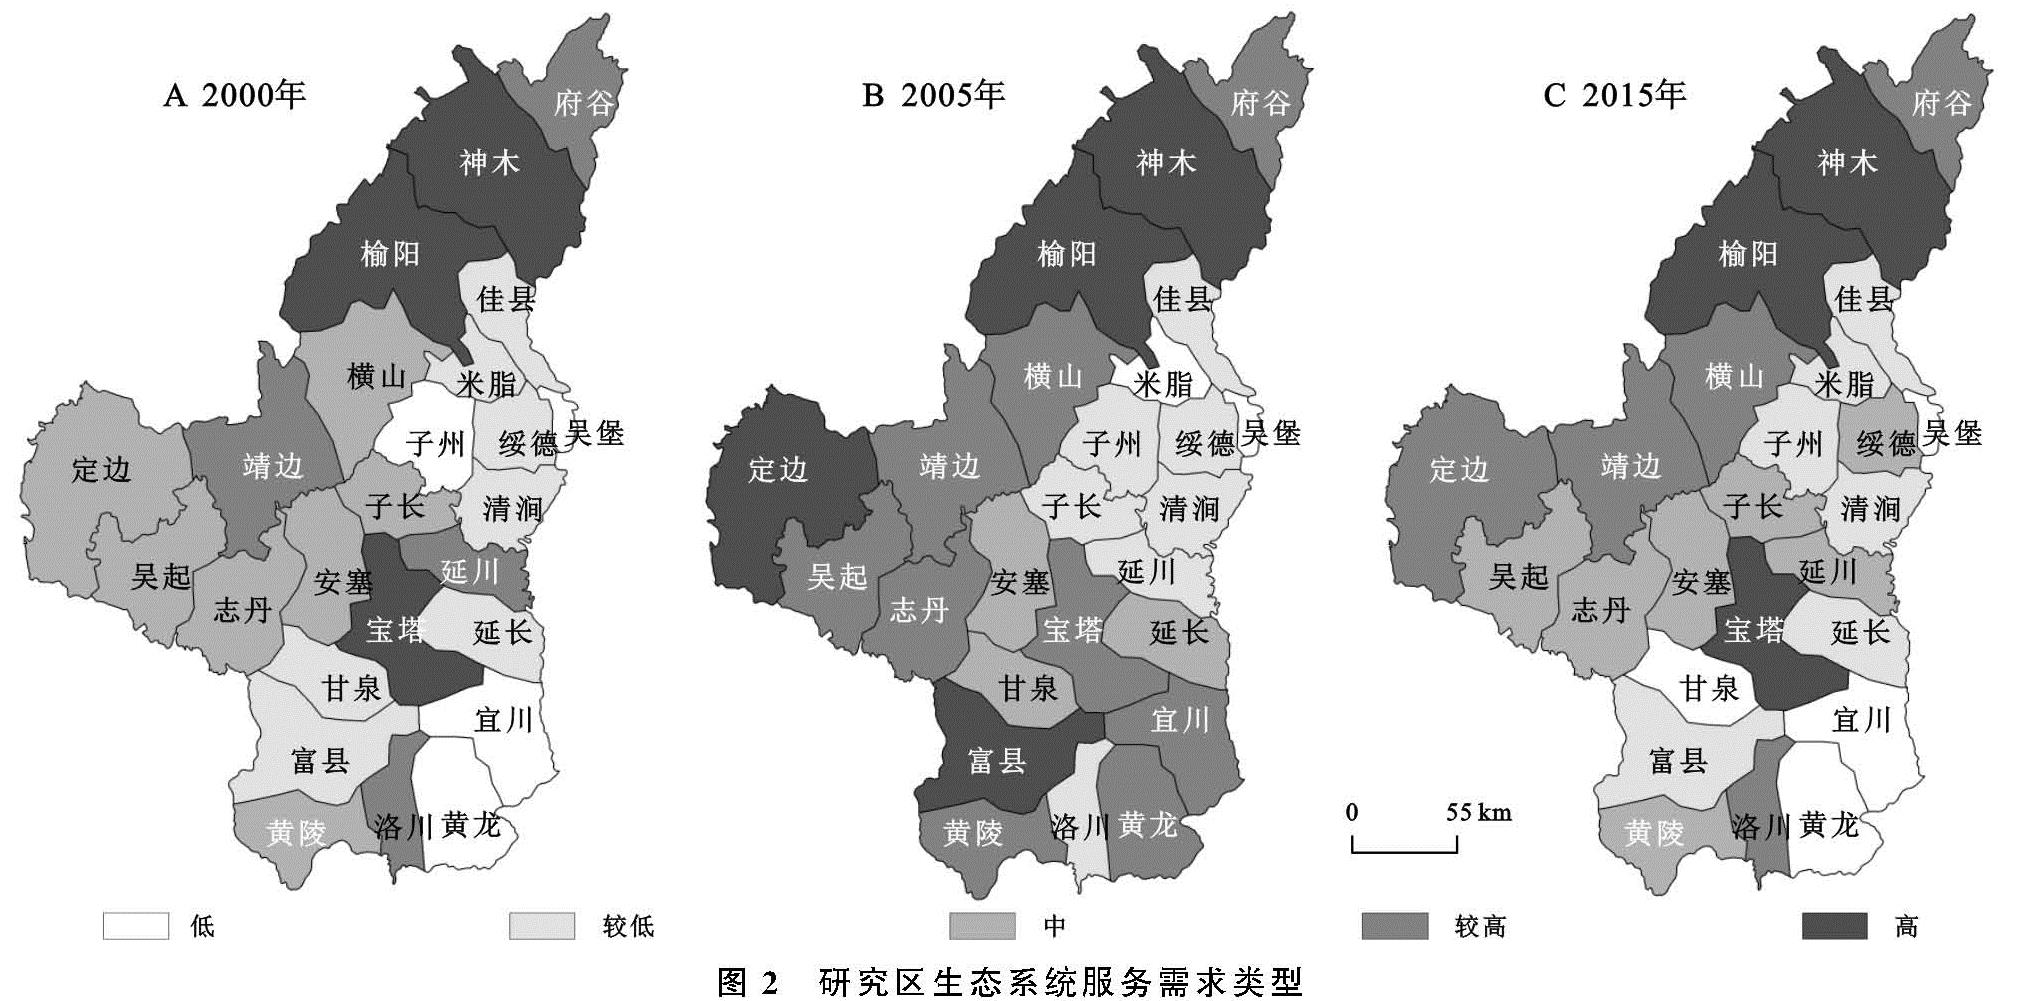
2.2 研究区生态系统服务需求时空分异
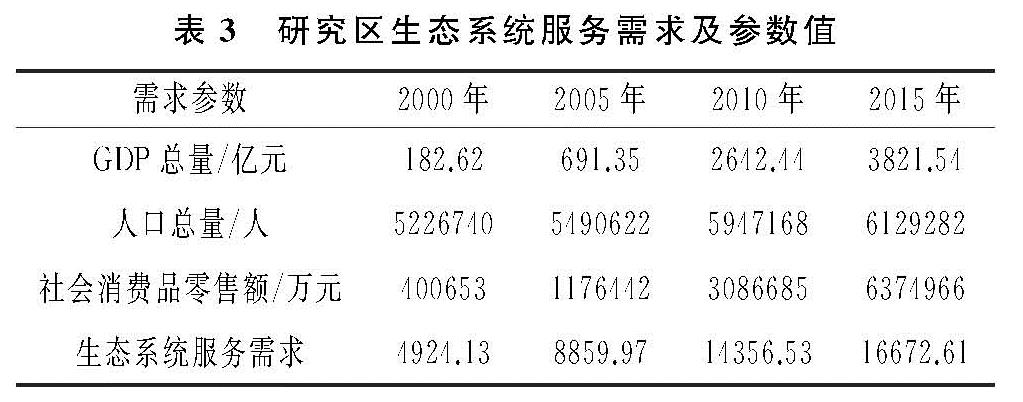
2000—2015年研究区生态系统服务需求各个参数增加明显。由表3可以看出,除人口总量保持较低的平稳增长外(1.17倍),GDP总量、社会消费品零售总额和生态系统服务需求均有较大变化。其中,GDP总量增幅最大,与2000年相比,2015年约为期初的20.93倍,社会消费品零售总额约为15.91倍。受GDP总量、社会消费品零售总额较大变化的影响,生态系统服务需求增长约为期初的3.4倍。
2000—2015年生态系统服务需求的空间格局大体保持不变(图2):研究区南部和中东部以低需求和较低需求类型为主,中西部以中需求和较高需求为主,北部以高需求为主。但从研究区整体看,生态系统服务需求呈现整体增加的趋势,主要表现在低和较低需求类型的县(市/区)减少,中等和较高类型区域增加。生态系统服务需求类型变化在研究区中部和南部表现较为明显。
2.3 研究区生态系统服务供需格局及其演变
为从供给与需求整体上探讨研究区生态系统服务时空分异,本文首先通过Z-score方法对生态系统服务供需数据进行标准化,得到研究区2000年、2005年和2015年生态系统服务供需特征表; 其次,基于公式(3)计算生态系统服务供需综合参数; 最后,基于上述计算结果对研究区生态系统服务供需类型进行划分,以此探讨其供需格局及其变化。
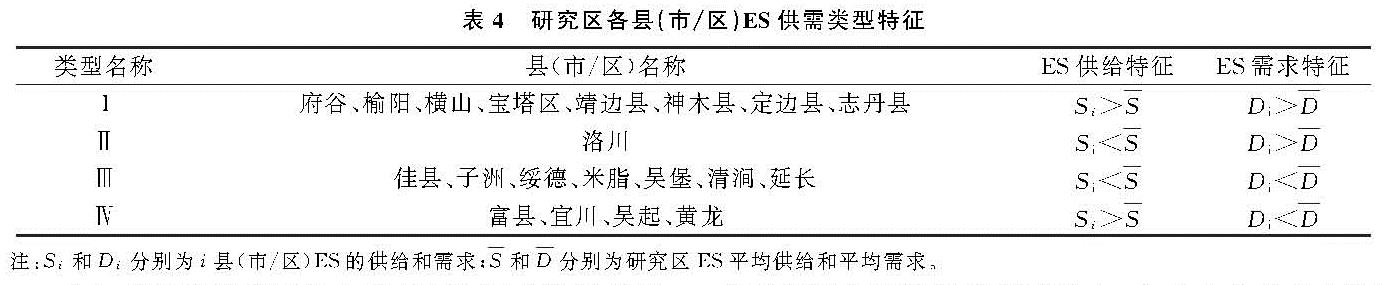
表4为研究期间保持供需特征一致的县(市/区)表。陕北黄土高原共有25个县(市/区),有20个县(市/区)的供需特征保持不变(表4),因此,研究区整体的供需特征大体保持一致。由表4可以看出:
(1)类型Ⅰ和类型Ⅳ中的县(市/区)ES的供给特征一致,ES的需求特征相反。两种类型的县(市/区)均拥有较大面积的林草地:类型Ⅰ有较大面积的草地,类型Ⅳ有较大面积的林地,使得其ES的供给大于研究区供给的平均水平; 与类型Ⅳ相比,类型Ⅰ中的县(市/区)在研究期间社会经济发展迅速,ES的需求增幅较大;
(2)类型Ⅱ和类型Ⅲ中的县(市/区)ES的供给特征一致,ES的需求特征相反。两种类型的县(市/区)拥有的林草地面积较少,使得其ES的供给小于研究区供给的平均水平; 与类型Ⅲ相比,类型Ⅱ中的县(市/区)在研究期间社会经济发展迅速,尤其是苹果产业发展迅速,使得其ES的需求增幅较大。
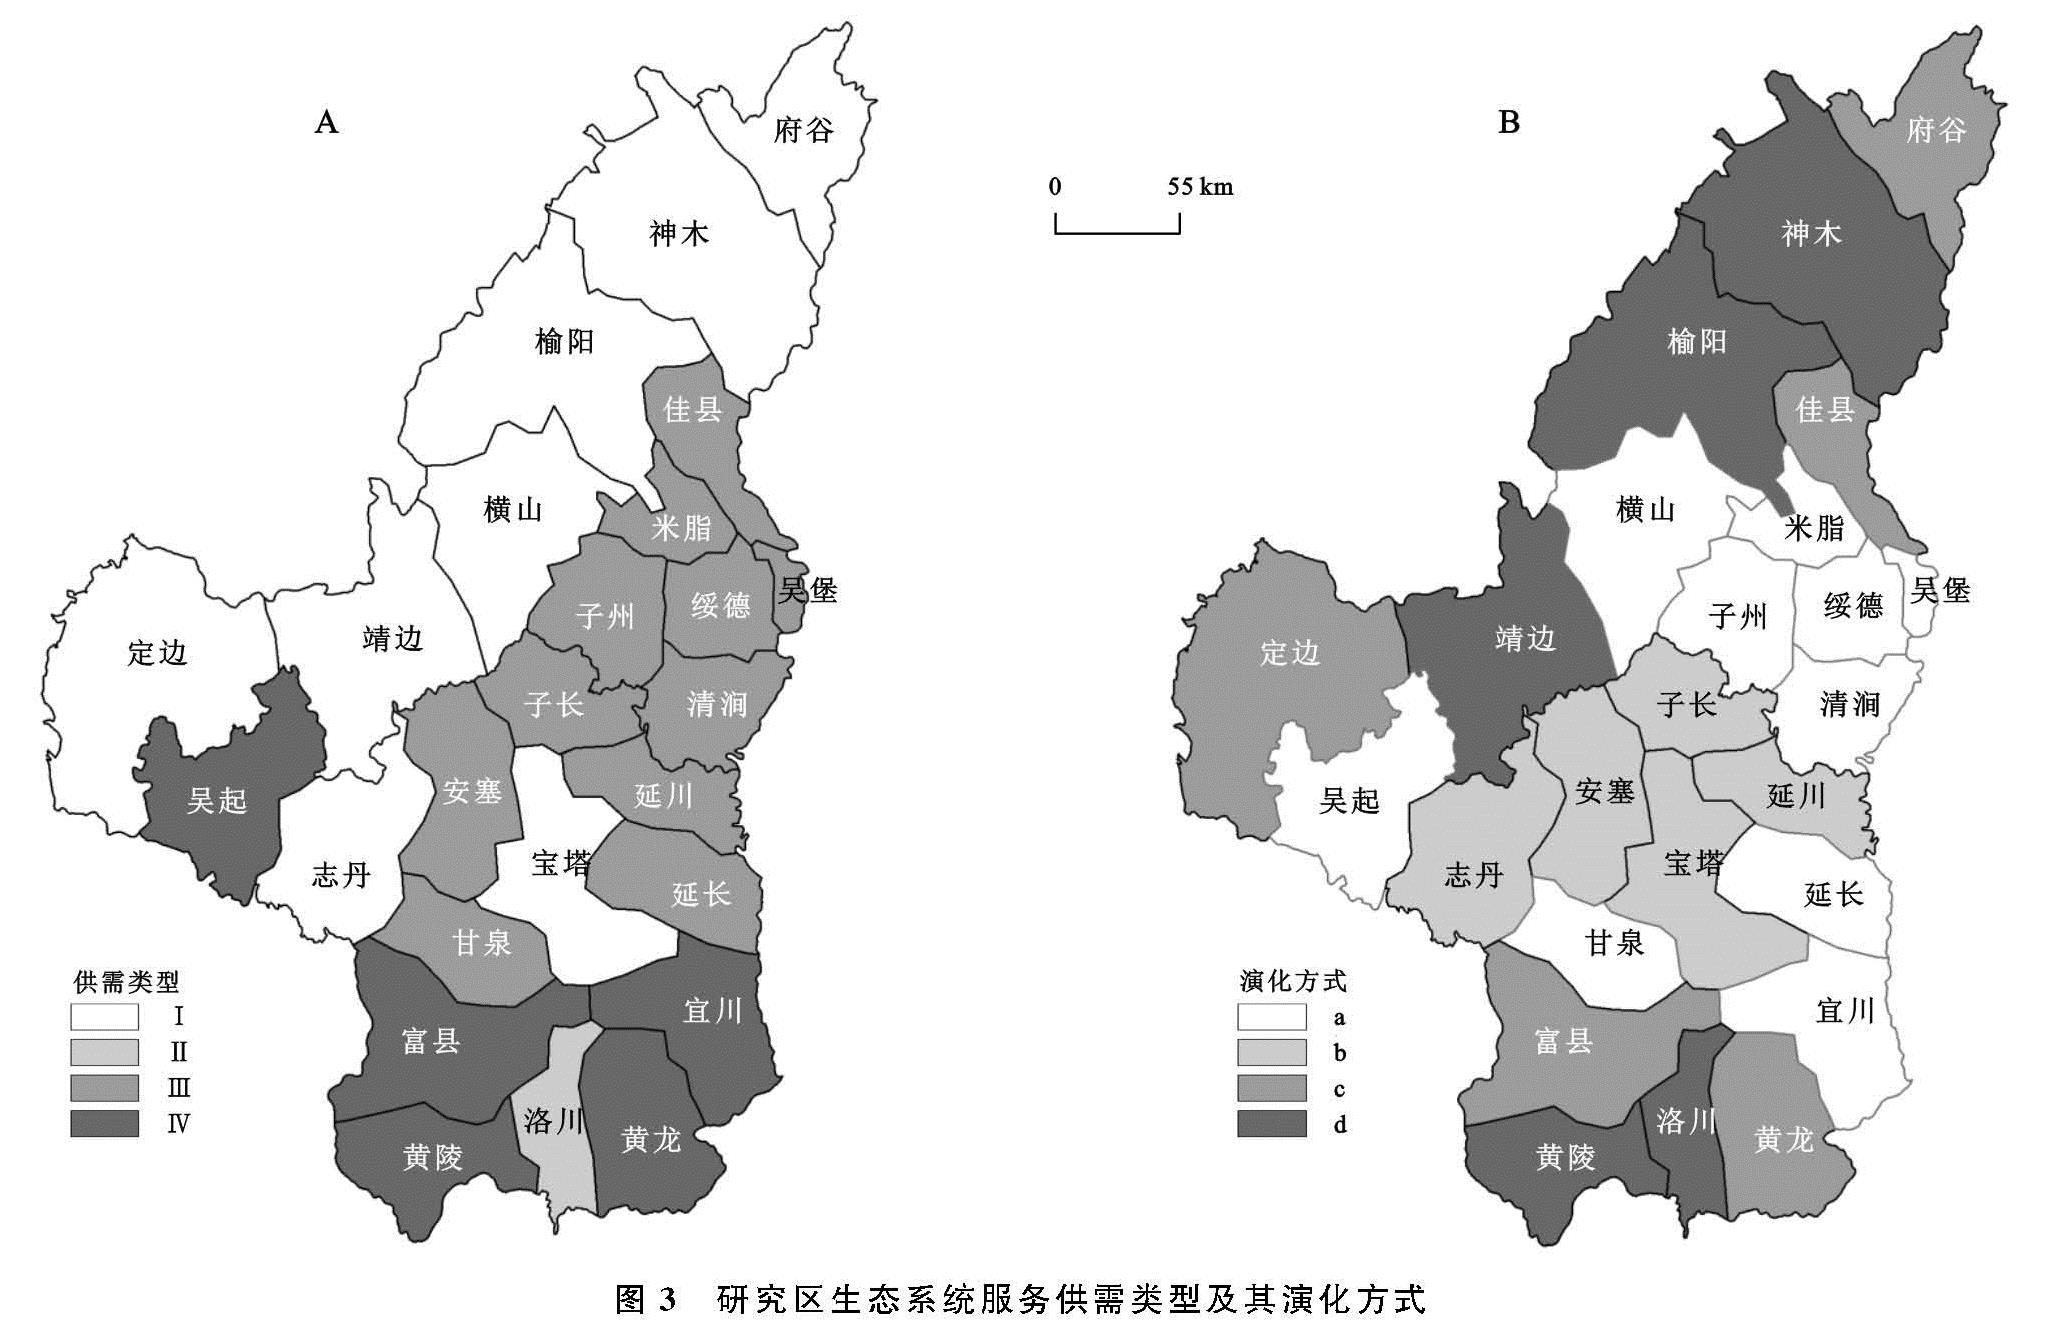
为了解研究区2000—2015年生态系统服务供需格局的演变,依据各县(市/区)在ES供给和需求方面的变化和特征,总结出该区生态系统服务供需格局及其演变特征:
(1)2000年、2005年和2015年生态系统服务时空格局大体保持一致(图3A)。主要是因为研究区西部和北部林草地面积大,加之该区大部分县市持续高速增长的GDP总量和社会消费品零售总额,形成生态系统服务供给与需求均大于或等于研究区平均水平的区域; 研究区的中东部属于黄土丘陵沟壑区,生态环境较差,同时该区GDP总量和社会消费品零售总额增长较快,由此形成需求高于平均水平,而供给小于平均水平的区域; 研究区南部虽然林草地面积大生态环境良好,但该区GDP总量和社会消费品零售总额增长较少,则形成供给大于平均水平,而需求小于研究区平均水平的区域。
(2)2000年、2005年和2015年生态系统服务格局演变大体有4种方式:方式a为供需均有较大增加; 方式b为需求略有增加,供给有较大增加; 方式c为需求有较大增加,供给略有增加; 方式d为供需均略有增加。4种方式的空间分布见图3B:方式a的各县(市/区)退耕还林较多,林草地面积有较大增加; 同时,这些区域的社会经济有长足发展,GDP总量和社会消费品零售总额的增幅较大; 方式b的各县(市/区)与方式a较为类似,退耕还林较多,林草地面积有较大增加,ES供给有较大增加,但上述区域GDP总量、社会消费品零售总额虽有所增加,但幅度较小; 方式c的各县(市/区)林地、草地和水域面积较大,退耕还林政策影响较小,但上述区域GDP总量和社会消费品零售总额的增长幅度较大; 方式d的各县(市/区),林草地覆盖率较高,退耕还林政策影响较小,且GDP总量和社会消费品零售总额的增长幅度较小。
依据研究区ES供需类型及其演化方式,对该区主要类型县(市/区)的生态系统服务供需提出相应的对策和措施:
类型I中的(市/区),其生态系统服务格局演化大多采用方式b、方式c和方式d,建议在保持ES供给适度增长的基础上,进一步提升其ES需求的增长幅度。这主要是因为该类县市生态环境已有较大改善,加之资源较为丰富,可保持ES需求较大增长。
类型Ⅱ仅有洛川县,其生态系统服务格局演化采用方式d,建议在保持ES供给适度增长的基础上,进一步提升和完善其苹果产业,提升ES的需求增长幅度。这主要是因为该县生态环境已有较大改善,加之苹果产业还有较大提升空间,可保持ES需求较大增长;
类型Ⅲ中的县(市/区),其ES格局演化大多采用方式a和方式b,建议在保持ES供给适度增长的基础上,适当放缓ES需求的增长幅度。主要是因为该类区域大规模退耕还林工作基本停止,ES供给大幅度提升状况也趋于停止。保持适度ES需求的增长,有利于该类县(市/区)的可持续发展。
类型Ⅳ中的县(市/区),其生态系统服务格局演化大多采用方式a和方式c,建议在保持现有ES供给的基础上,进一步提升其ES需求的增长幅度。主要是因为该类县(市/区)生态环境较好,ES需求提升的空间较大。