3.1 生物结皮覆盖土壤碳通量月动态变化及其驱动因子
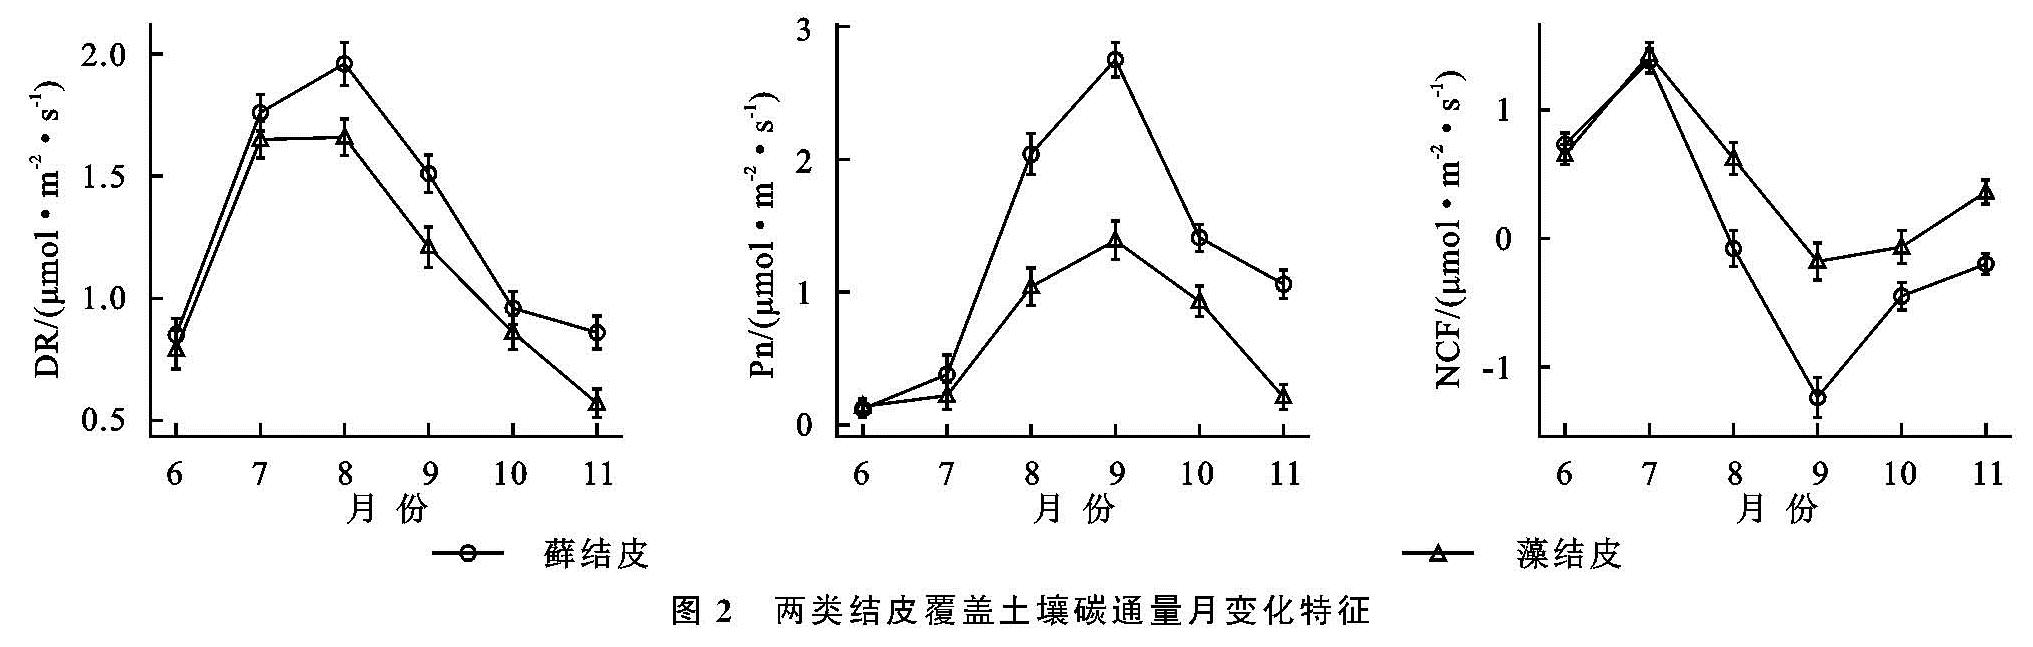
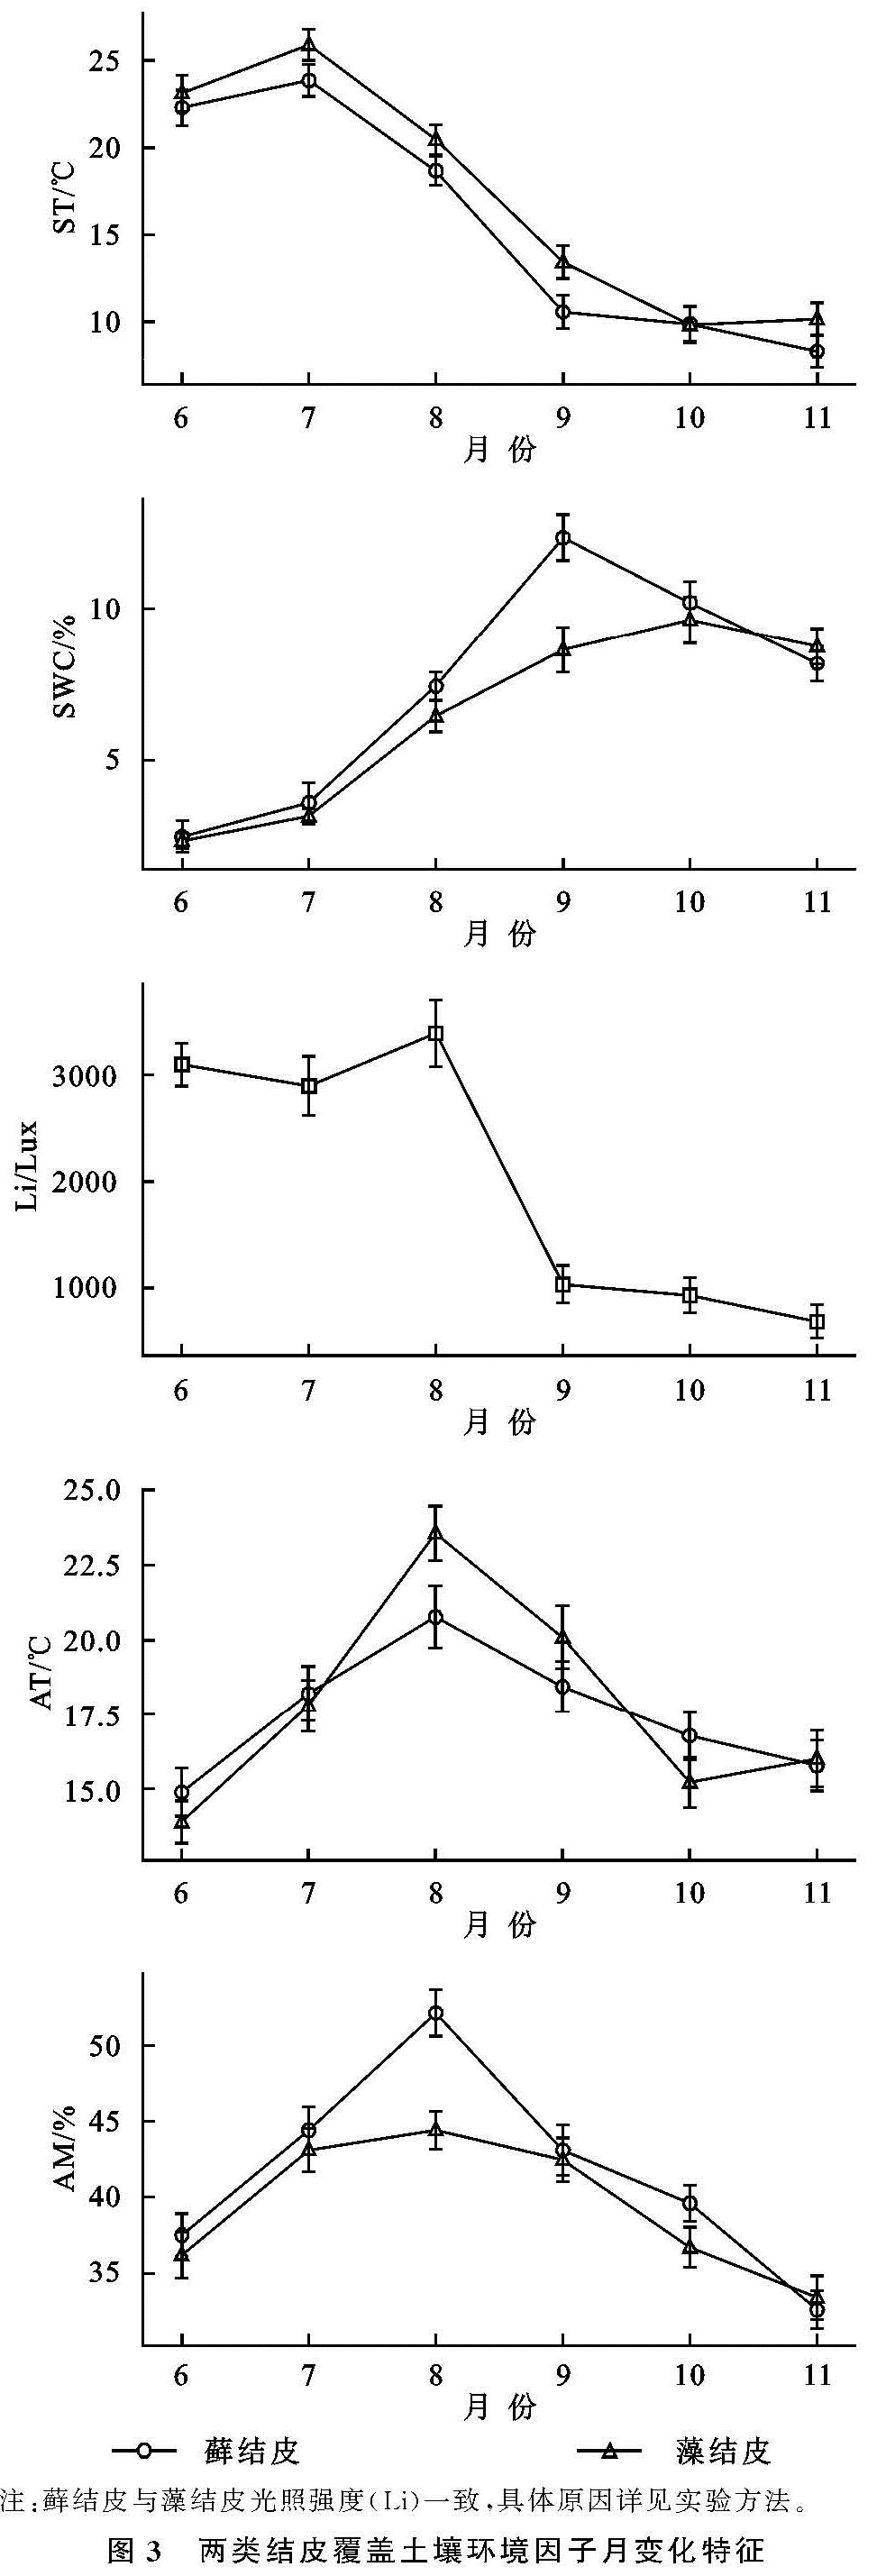
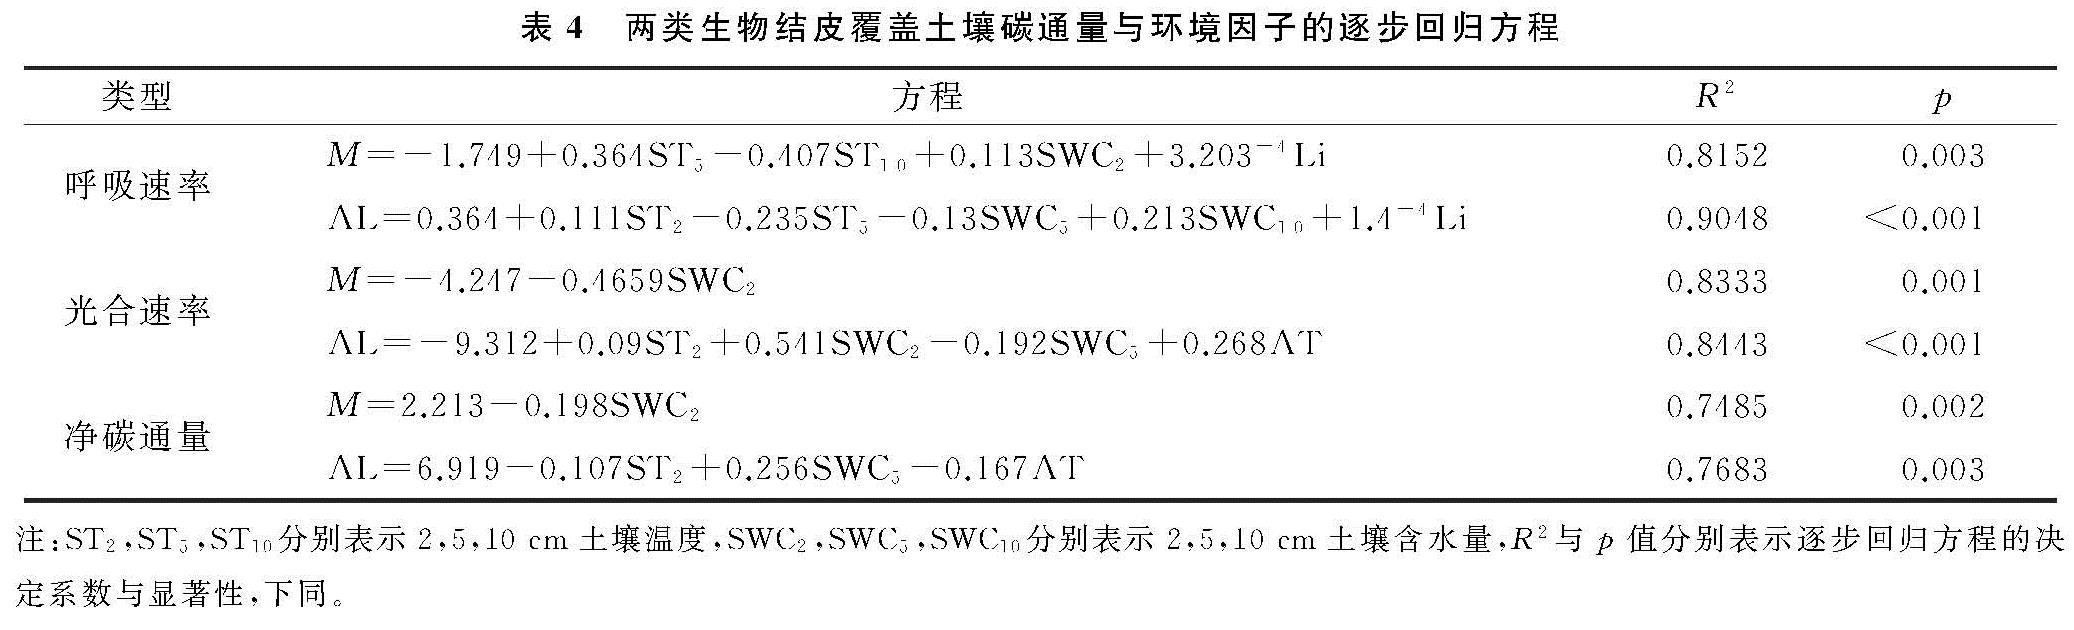
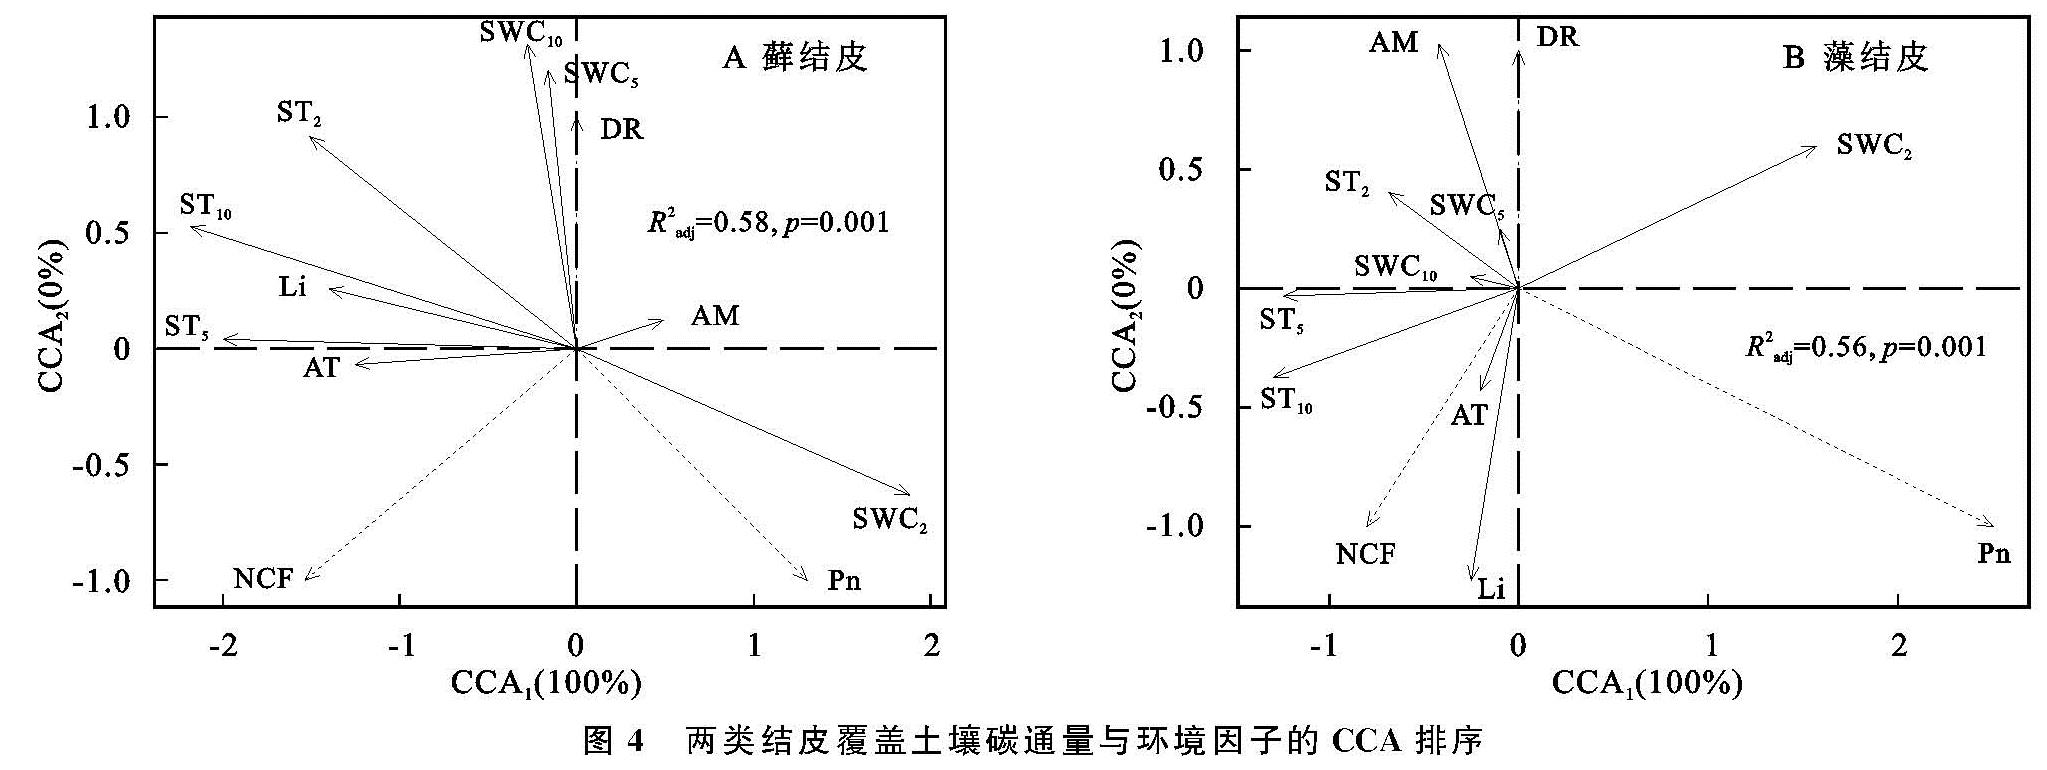
两类生物结皮覆盖土壤的呼吸速率月动态变化为先升后降,在光照强烈、土壤含水量适中的8月达到峰值(图2—3)。在腾格里沙漠,Guan等[21]也发现类似规律:藓、藻两类结皮覆盖土壤呼吸速率在土壤温度最高、降雨适中的7月达到峰值。逐步回归(表4)与CCA分析(图3,表4)表明:5,10 cm土壤含水量,2,5,10 cm土壤温度以及光照强度与两类生物结皮土壤覆盖呼吸速率正相关性较强,是驱动两类结皮土壤呼吸速率月动态变化的关键因子。土壤温度的升高会刺激土壤酶活性,加速土壤有机质的分解[25]。土壤含水量的升高则会直接影响养分矿化速率和土壤微生物活性,改变土体氧化还原电位和气体交换速率,进而改变土壤碳通量[26]。光照强度的升高(图2)会促进两类结皮的生理活性,为其自身呼吸提供了更多碳源[8]。8月前,干燥的生物结皮土壤已经积累了一定的呼吸底物,进入8月,土壤含水量上升、光照强度达到峰值,因此,两类结皮覆盖土壤呼吸速率迅速上升,并在8月达到峰值。生长期中,藓结皮覆盖土壤呼吸速率显著高于藻结皮(表2)。不仅是因为藓结皮比藻结皮有更强的呼吸活性,还存在其他影响因素。一方面藓结皮比藻结皮能够更长时间的保持水分有效性,减缓水分蒸发和下渗,维持其自身呼吸活性。另一方面藓结皮比藻结皮覆盖土壤孔隙度更大,黏粒和养分含量更高,更有利于其下伏土壤呼吸作用[3]。
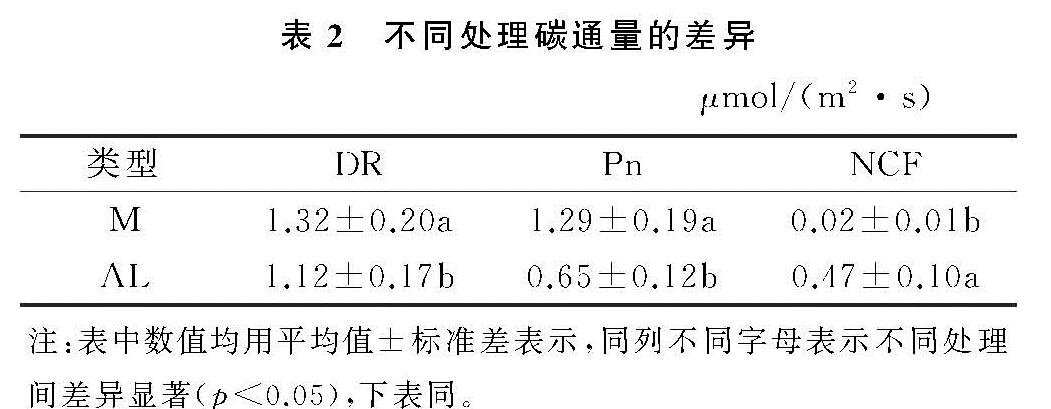
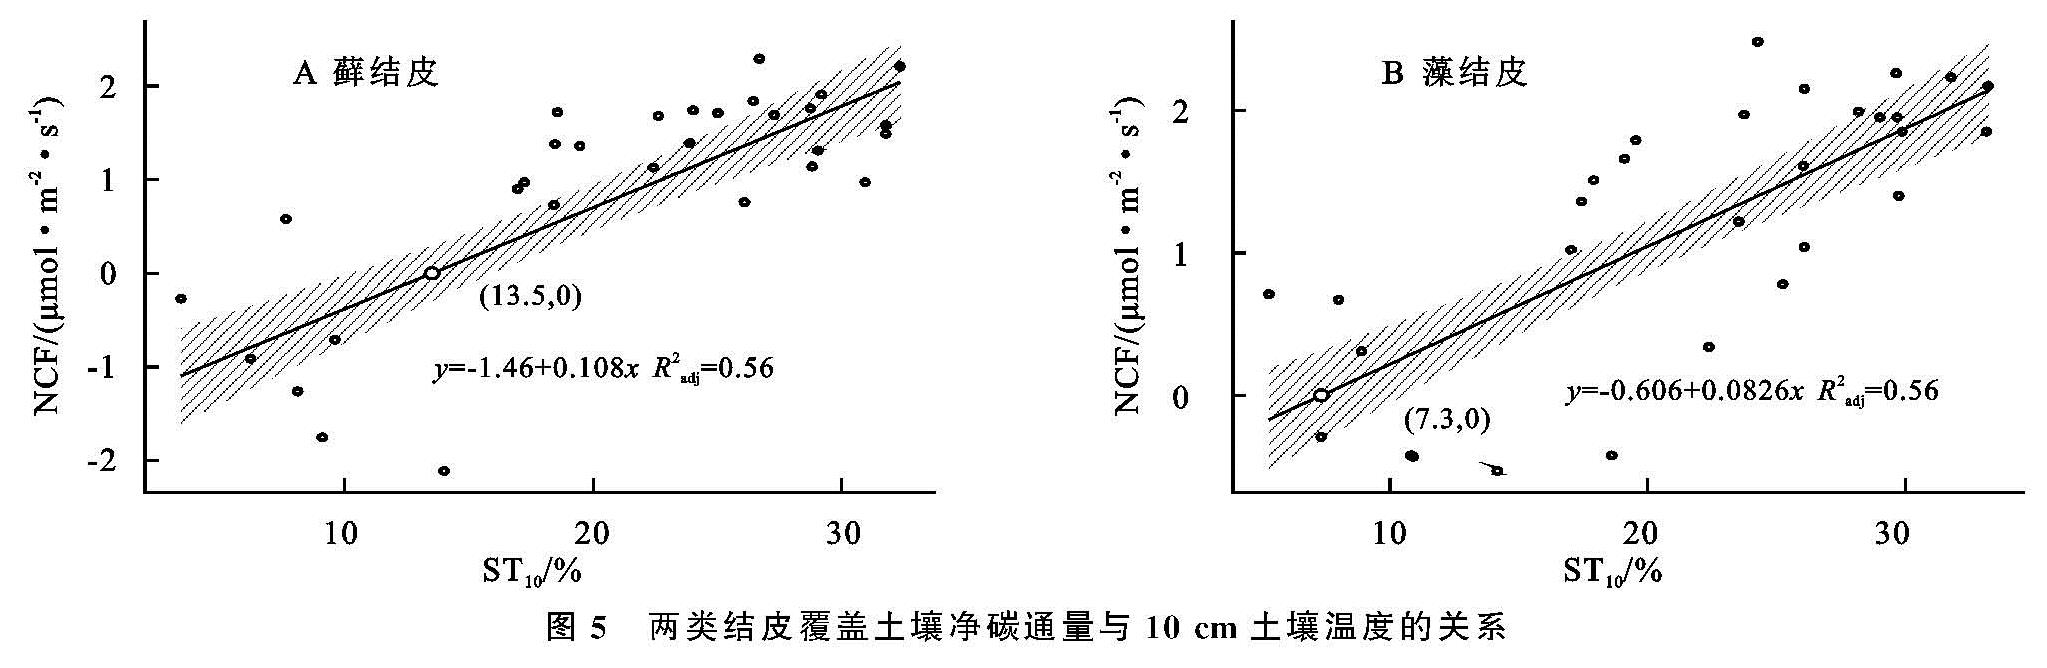
图5 两类结皮覆盖土壤净碳通量与10 cm土壤温度的关系
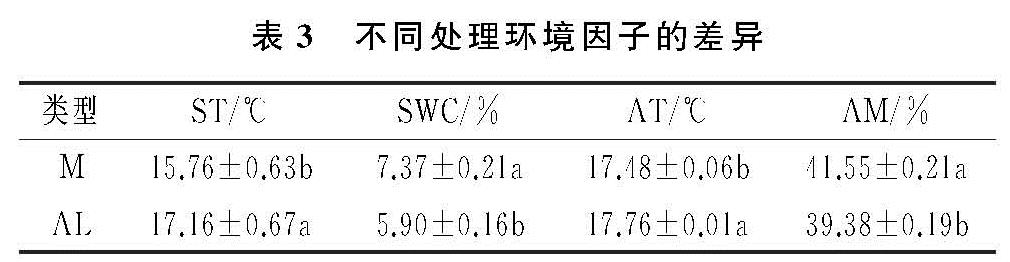
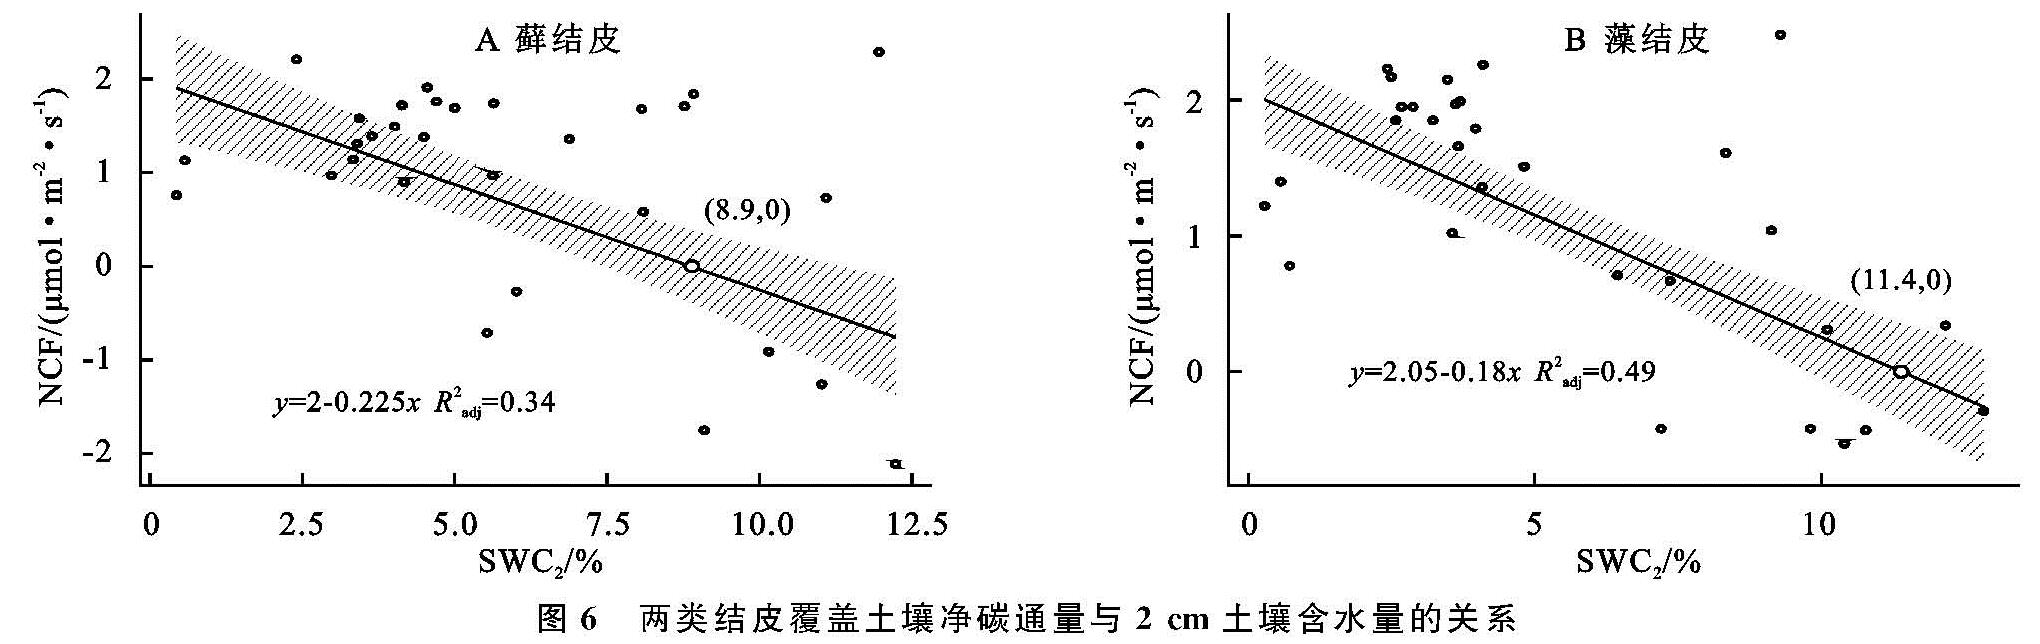
图6 两类结皮覆盖土壤净碳通量与2 cm土壤含水量的关系
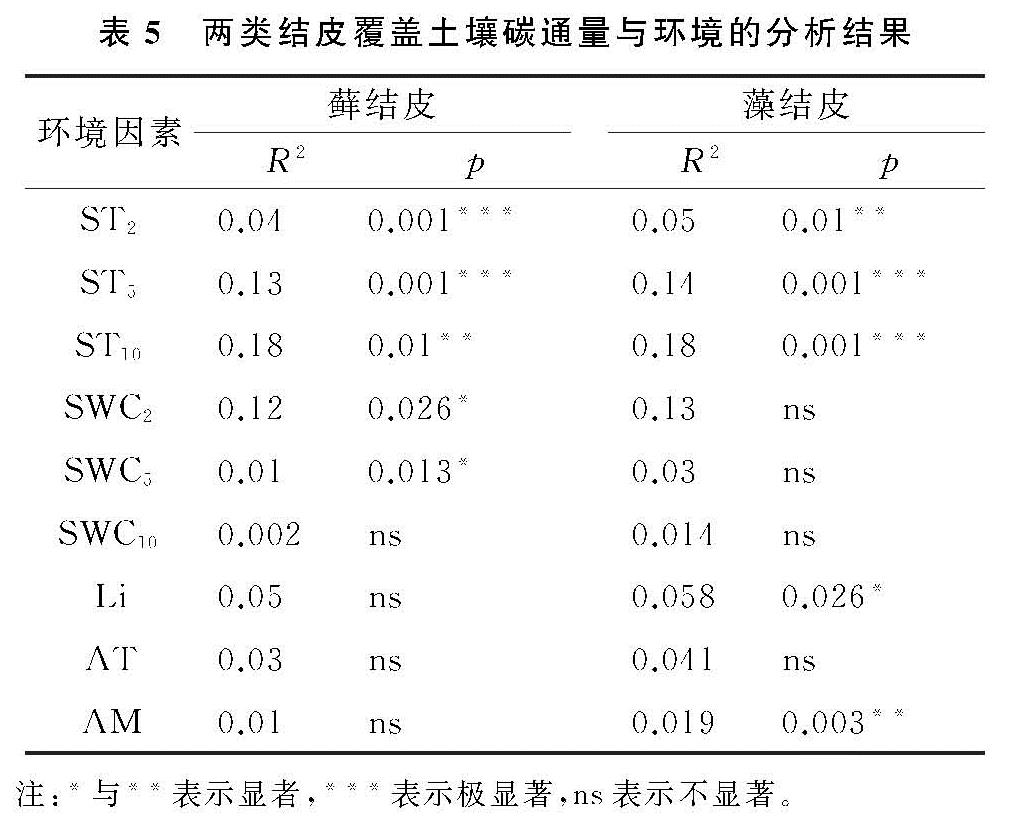
两类生物结皮的光合速率与土壤含水量月变化同步,先升后降,9月达到峰值。逐步回归(表4)与CCA分析(图4,表5)表明:2 cm土壤含水量与两类生物结皮光合速率正相关性较强,是驱动两类生物结皮光合速率月动态变化最关键的因子,此外2,5,10 cm土壤温度、光照强度与两类生物结皮光合速率负相关性较强,也是影响两类结皮光合速率月动态变化的重要因子。进入9月,光照强度的大幅下降,土壤含水量的大幅上升(图3),一方面使生物结皮土壤的湿润周期变长,另一方面使土壤温度与近地表空气温度处于较低的水平。因此两类生物结皮的光合速率在9月达到峰值。尽管藓结皮光合速率与光照强度显示出了较强的负相关性(图3),太阳辐射最为强烈的8月,藓结皮光合速率仍然处于较高水平。这可能是因为水分充足时,藓结皮的光合过程能够很好地适应光照强度的变化。例如,赵允格等[13]发现光照对黄土丘陵区藓类结皮的光合作用没有抑制作用。同时,藻结皮光合速率在8月同样处于较高水平,表明藻结皮光合作用过程受光照强度变化影响较小。例如,Karsten等[10]发现非洲南部干旱地区的热沙漠和美国阿拉斯加州的冷沙漠的BSC中的4种丝状绿藻在较低光照下光合产氧量依然较高,而高光照条件无抑制作用。藻结皮光合速率与光照强度存相关性较弱(图4)也证实了这点。整个生长期中,藓结皮光合速率显著高于藻结皮。原因在于藓结皮持水能力更强,叶绿素a,b含量高,其光合活性更高,能够吸收更多的CO2。此外,藓结皮覆盖土壤含水量显著高于藻结皮、土壤温度显著低于藻结皮(表3),更有利于其进行光合作用[6,26]。
两类结皮覆盖土壤净碳通量月变化为先升后降再升,7月出现峰值,与土壤温度月动态变化出现峰值的月份一致,9月出现谷值,与土壤含水量月动态变化出现峰值的月份一致。CCA分析表明(图4),两类生物结皮覆盖土壤净碳通量与5,10 cm土壤温度、光照强度、近地表空气温度正相关性较强,与2,5,10 cm土壤含水量、近地表空气湿度存在较强的负相关性较强。毛乌素沙地干湿季分明[27],在降雨集中、光照强烈、土壤温度最高的7月(干季),两类生物结皮覆盖土壤的呼吸速率明显高于光合速率,因此净碳通量达到峰值,而在光照适宜、土壤含水量较高的9月(湿季),光合速率明显强于呼吸速率,因此净碳通量达到谷值(图2—3)。整个生长期中,两类结皮净碳通量均大于0(表2),表明两类生物结皮覆盖土壤表现出碳源作用。可能是因为两类生物结皮的光合速率较低,不能抵消土壤呼吸所致[3]。藓结皮净碳通量显著低于藻结皮(表2)。表明藓结皮的净碳固定能力更强,能够通过光合作用吸收更多自身及其下伏土壤呼吸产生的CO2。
3.2 生物结皮覆盖土壤净碳通量对气候变化的潜在响应
安莉娟[28]研究显示:未来毛乌素沙地气温呈上升趋势,年降水减少,干旱加剧。两类生物结皮覆盖土壤净碳通量的变化与土壤温度及近地表空气温度升高正相关较强,与2 cm土壤含水量及近地表空气湿度负相关性较强(图4),表明气温的上升与降雨量的减少会增加两类生物结皮碳损失的风险。虽然生物结皮光合过程对温度升高的响应具有弹性[29],但鉴于适宜研究区两类生物结皮净碳固定(NCF<0)的土壤温度范围较窄(图5),两类生物结皮的群落组成及其对环境因子的生理适应能力未发生变化时,增温减雨会导致生物结皮覆盖土壤净碳通量有升高,使其释放的CO2更难被光合固定的CO2取代,进入“C饥饿”的状态。藓结皮净碳固定的土壤温度阈值(13.5℃)显著高于藻结皮(7.3℃)(图5),土壤水分阈值(8.9%)明显低于藻结皮(11.4%)(图6),表明增温减雨的气候变化更可能导致藻结皮覆盖土壤的碳损失,因此未来需要关注野外环境中生物土壤结皮碳通量与环境因子之间复杂的联结关系[6],以明确全球气候变化下生物土壤结皮的碳效应。