4.1.1 对研究方法的讨论
从生态系统服务类型分类体系来看,目前在生态系统服务的分类上仍然存在很大分歧,多数学者将生态系统服务分为供给、调节、文化和支持服务[1-3]。由于研究目的不同,喀斯特区域生态系统服务的分类也是多样的。根据文献统计及喀斯特山区特征[2],食物供给、产水量、土壤保持、固碳、生境支持和文化服务是当前研究喀斯特区生态系统服务较为关注的。因此,结合学界研究成果及前人研究方法[27-29],选取符合广南县喀斯特山区实际的生态系统服务类型,以食物供给、产水量、土壤保持、固碳、生境支持和文化服务6种生态系统服务为研究对象,评估广南县喀斯特山区的生态系统服务。
根据案例统计及研究区特征[27-29],目前喀斯特区域生态系统服务评估方法大多选用模型评估法,模型主要选用InVEST,CASA和RUSLE模型等。其中InVEST模型内涵评估模块较多,发展最为完善。总体来看,研究采用InVEST模型、CASA模型和RUSLE模型等模型来评估生态系统服务,模型具有导入数据少、输出数据量大和复杂问题简化处理优点。
从生态系统服务权衡与协同研究方法看,多采用定性分析法和相关分析法[14-15]。而相关性分析是较为简单实用的方法。因此,本研究参照前人方法[14-15]采用相关分析法分析生态系统服务权衡与协同关系,结果较为合理; 从生态系统服务热点区研究方法看,生态系统服务热点区研究方法主要分为直接分类法和空间统计分析方法。研究采用直接分类法分析生态系统服务提供能力的强弱空间分布,具有简单直观的优点,能够满足研究需求。
4.1.2 对研究结果的讨论
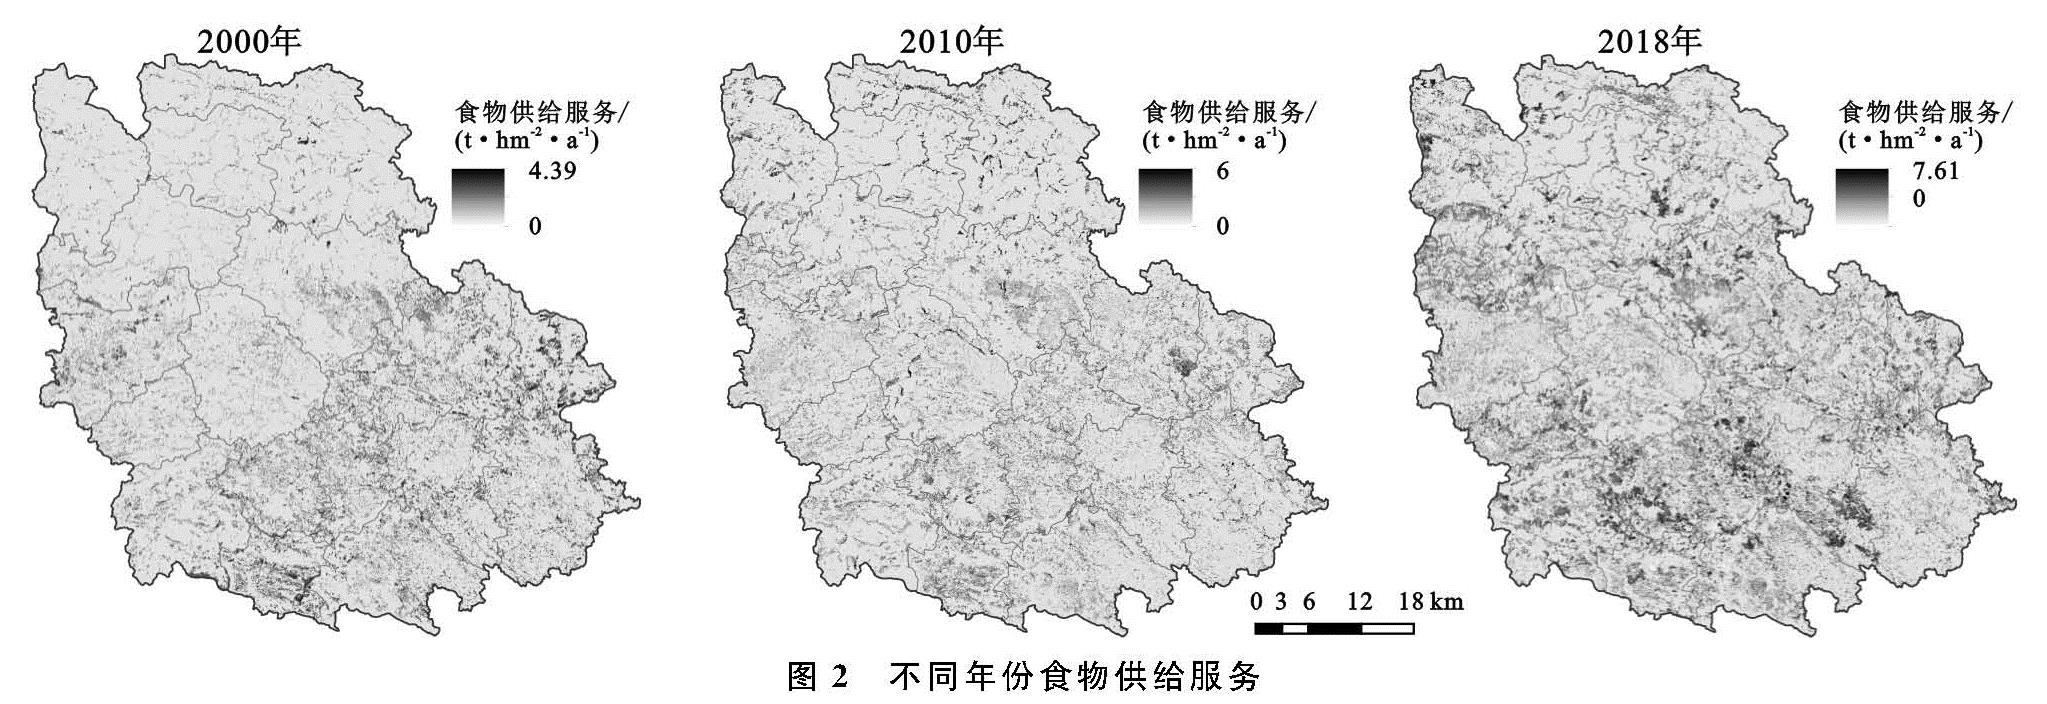
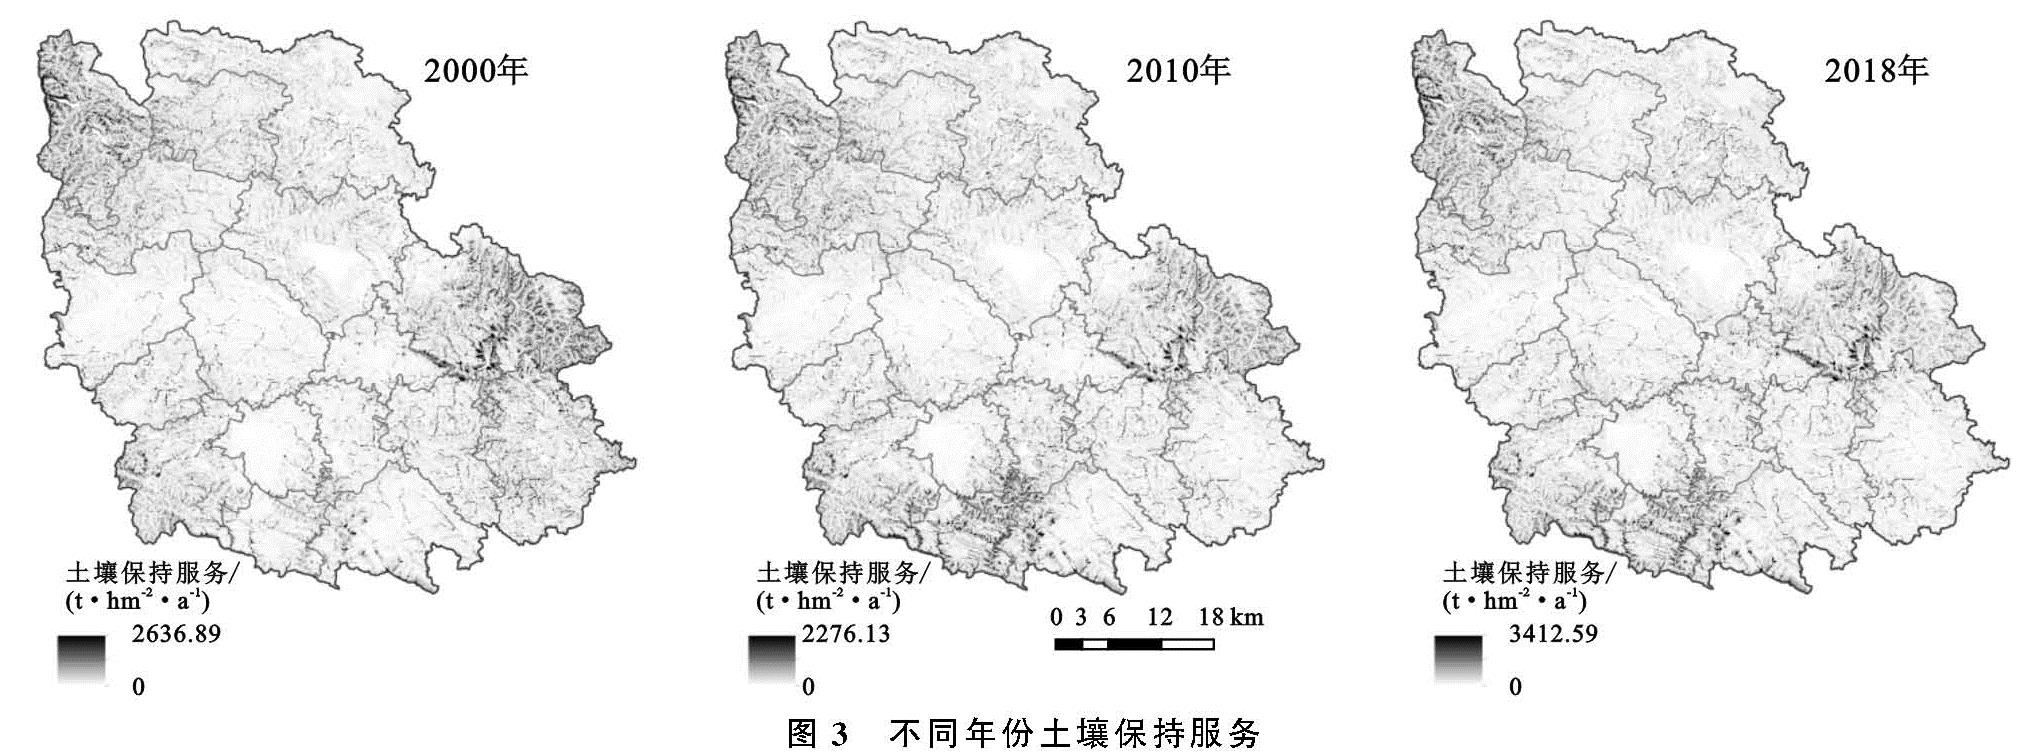
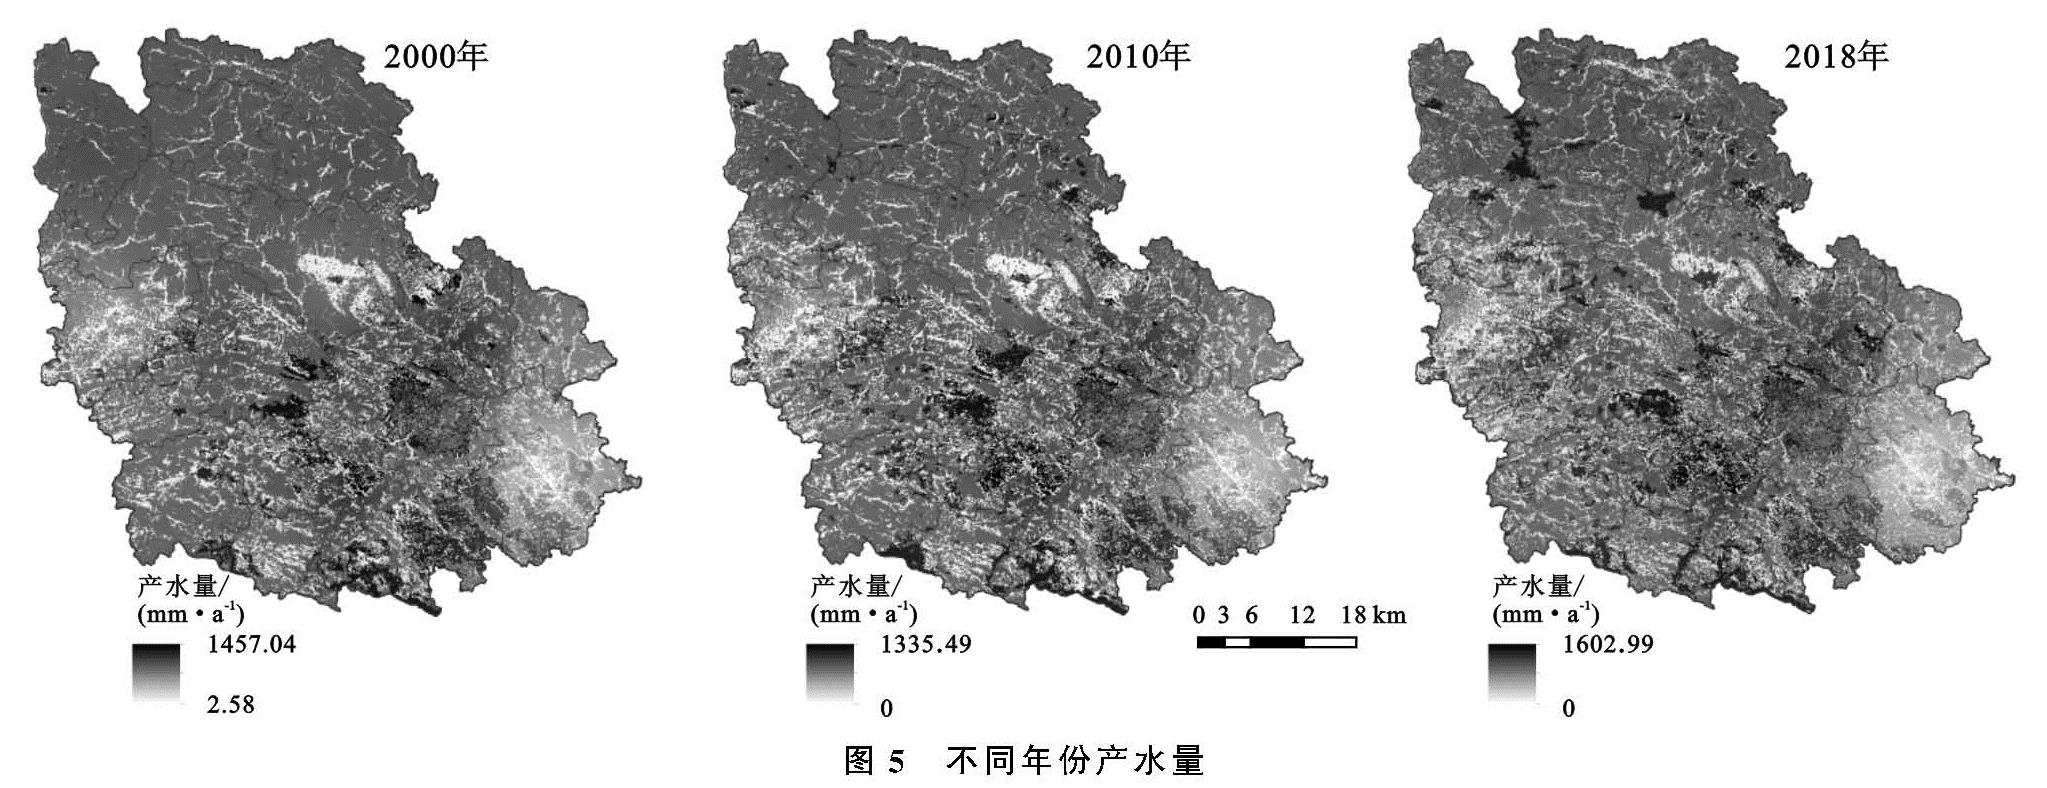
与前人研究结果进行对比,本研究生态系统服务核算结果与其他研究结果基本处于同一数量级,因此,3期食物供给年平均产量分别为1.79,2.62,3.38 t/hm2,参考广南县三期统计年鉴为1.76,2.28,3.36 t/hm2。通过对比发现,研究结果与基本情况较为符合; 年平均土壤保持量为821.92,764.31,951.59 t/hm2,Lang等[29]在贵州、广西两省的喀斯特山区研究中2000年和2010年平均土壤保持量分别为1 011,1 035 t/hm2,研究结果虽然为喀斯特区域,但因与研究区自然环境存在差异,总体上结果与本研究较为符合; 年均NPP为781.20,715.01,739.50 g C/(m2·a)。陈峰等[23]的研究中,年均NPP为689.34 g C/(m2·a),结果与本研究较为符合; 平均产水量763.68,685.94,780.71 mm。Lang等[29]在贵州、广西两省的喀斯特山区研究中2000年和2010年平均产水量为954.52,968.10 mm,因产水量受降雨量和蒸发量影响因素较大,因此,本研究结果较为合理; 生境支持服务取值范围为0~1,空间分布结果与广南县实际生态环境状况相符,研究结果较为合理; Chen等[25]在研究中2008年的文化服务价值范围为0~1 585.3元,而本研究2010年0.001~1 790.91元,和本研究结果较为符合。总之,由于研究区不同,研究结果会有差异,但同一纬度带西南地区的生态系统服务核算结果相差不大。因此,认为模型对喀斯特地区广南县生态系统服务的评估是可行的。
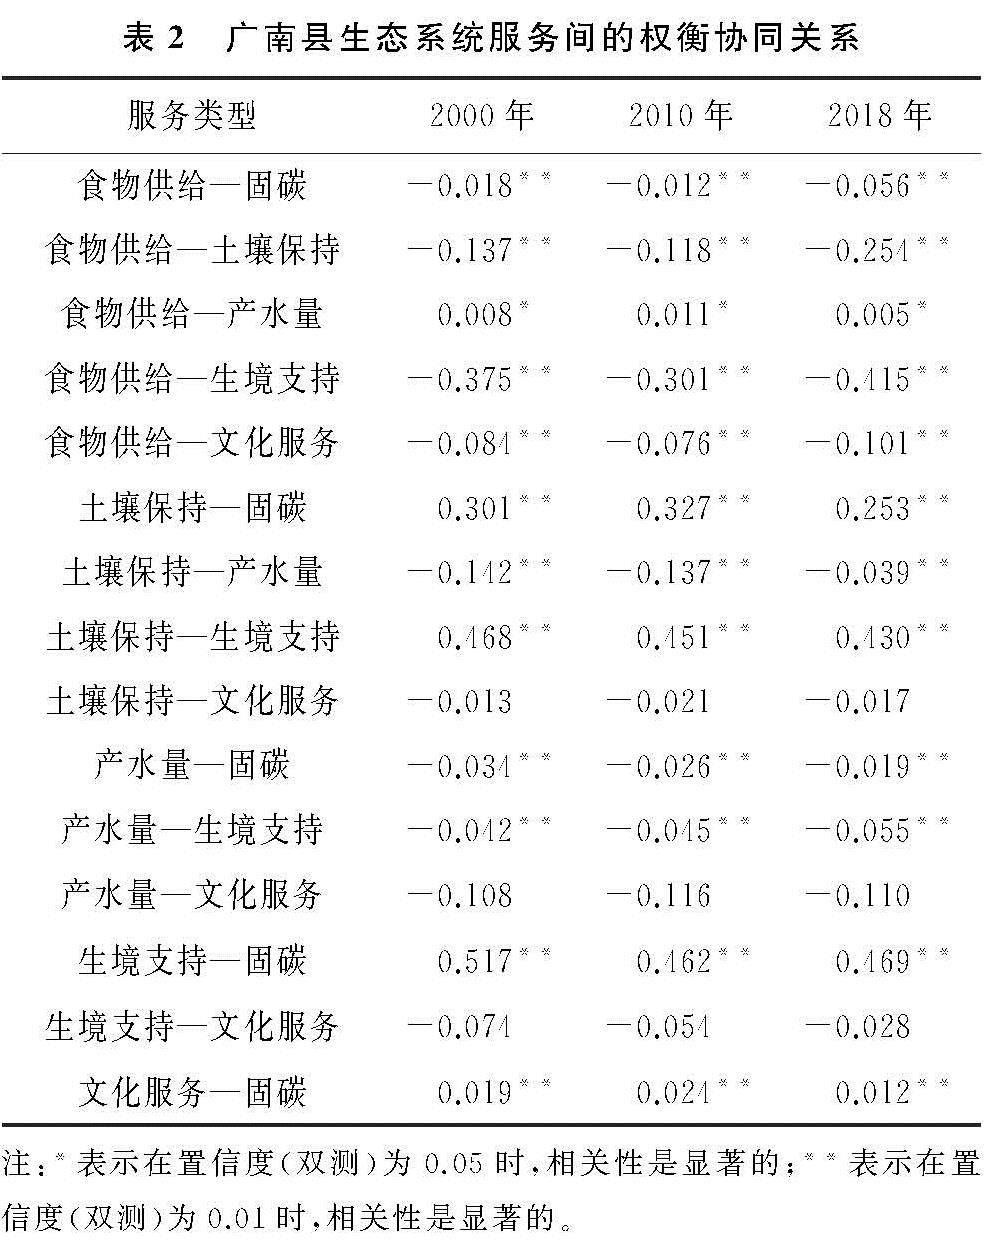
对于生态系统服务权衡与协同关系研究,研究结果与其他研究者在相似地区的研究结果一致,如吴瑞东[26]研究中固碳—土壤保持和固碳—生境支持生态系统服务均为协同关系,食物供给—生境支持为权衡关系,与本研究结果较为符合; 郎焱卿[27]研究中土壤保持—产水量为权衡关系,结果与本研究较为一致,研究结果较为合理。固碳—土壤保持为协同关系、与产水量为权衡关系,这是由于植被覆盖度高的地区蒸发量更高、更容易保持土壤,且上述3种关系在空间上分布差异明显。以土壤保持量与产水量为例,从约束阈值角度来分析,土壤保持量高的地区降雨量较高,降雨作为产水量的主要来源,使得土壤保持与产水呈协同关系; 而土壤保持量高的地区,通常植被覆盖较好,在一定程度上对产水服务又有所抑制。当降雨量超过某一阈值时,二者间的权衡协同关系将发生转变,这可以解释为降雨量对土壤保持量的阈值效应,也是生态系统服务权衡协同关系在空间分布上出现差异的重要原因,在今后的研究中,需要对生态系统服务权衡协同关系转变的因素进行分析,同时对其内部结构与运行机理进行更加深入细致的研究。由于研究仅仅选取了6个生态系统服务进行研究,一定程度限制其他生态系统服务关系的研究。因此,在以后的研究中,应丰富喀斯特区生态系统服务研究内容。
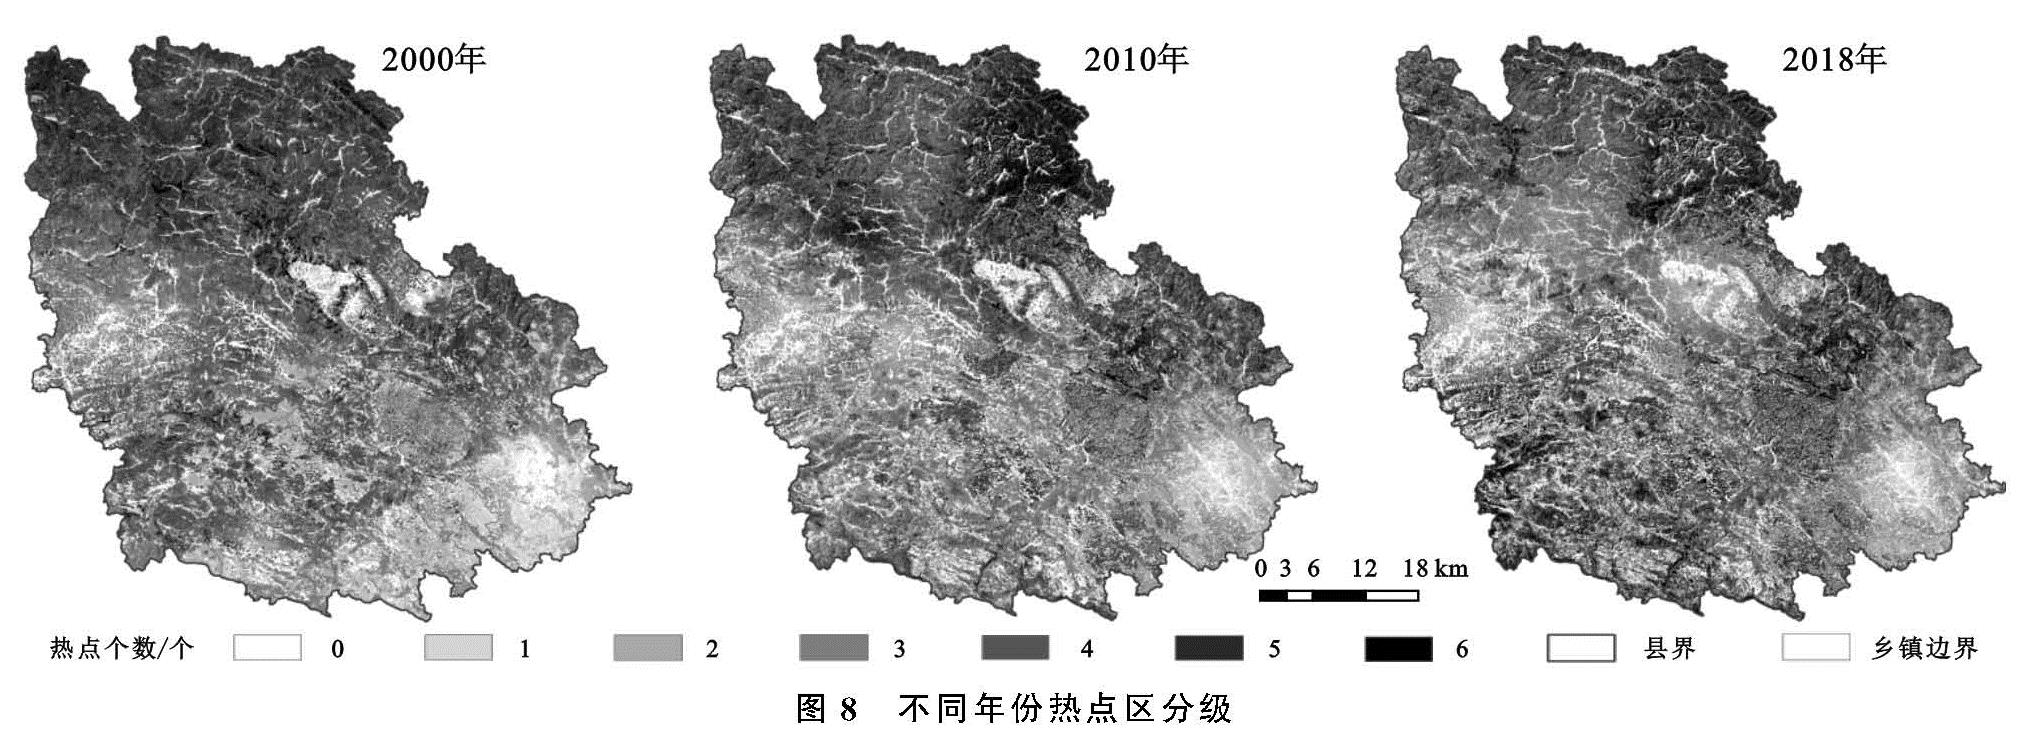
在生态系统服务热点区研究上,本研究的热点区时间和空间特征都可以表征2000年、2010年和2018年广南县的生态系统服务,总体上研究结果与研究区基本情况较为符合。但由于热点划分时选取的标准不同,使得不同区域热点区研究结果无法进行横向和纵向的对比。因此,热点区研究方法和标准的选取问题在现阶段不易完全消除,需要在以后的研究中更加关注。
4.2 结 论
(1)2000—2018年,研究区食物供给服务和文化服务与石漠化程度空间分布基本无相关性,而土壤保持服务、固碳服务、产水量和生境支持服务与石漠化程度空间分布大体呈负相关,石漠化程度较高的区域,土壤保持、固碳、产水量和生境支持等生态系统服务功能较低,而无石漠化区域,土壤保持、固碳、产水量和生境支持等生态系统服务功能较高。
(2)2000—2018年,研究区生境支持—土壤保持、生境支持—固碳、土壤保持—固碳、文化服务—固碳和产水量—食物供给呈协同关系,而产水量—土壤保持、产水量—固碳、产水量—生境支持、产水量—文化服务、固碳—食物供给呈权衡关系。
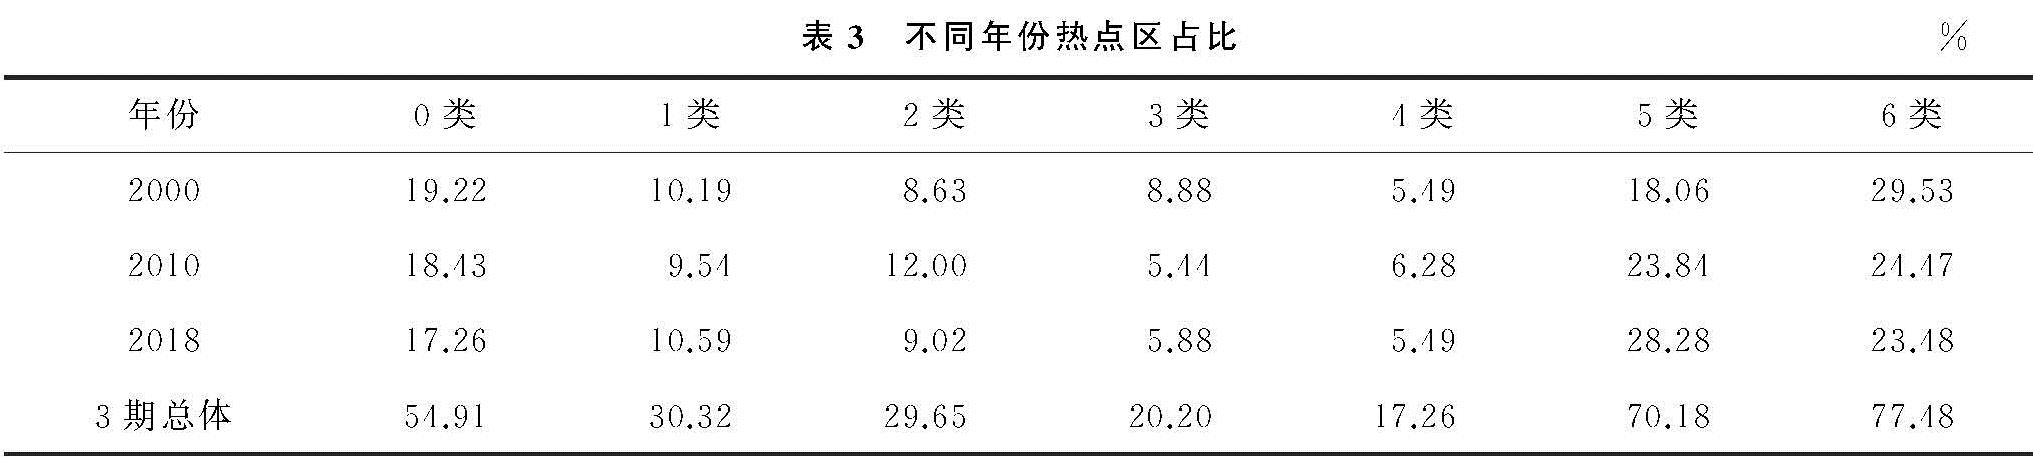
(3)2000—2018年,研究区三期热点区总体占比大小依次为“6类”>“5类”>“0类”>“1类”>“2类”>“3类”>“4类”,其中,“0类”和“6类”热点区呈不断减少趋势,“1类”和“3类”热点区呈先减少后增加趋势; “5类”热点区呈不断增加趋势,“2类”热点区呈先增加后减少趋势; 空间上,“0类”服务区为生态脆弱区且为无热点区,分布在石漠化重度区域,主要为分布在中部和西南部,应继续采取相应的生态恢复措施; “1类”、“2类”和“3类”服务区为热点区,分布在石漠化轻度及潜在区域,主要为在西南部、中部和东部; “4类”和“5类”为热点区,基本分布在无石漠化区域,主要为在北部及东部; “6类”服务区为热点区,该区域为供给能力最高的区域,但面积占比较少,且主要分布在北部及东北部,需优先保护。