2.1 玉溪市生态环境质量时空变化
根据上述公式计算绿度、湿度、干度、热度及RSEI结果可分析玉溪市生态环境质量的变化情况(图1)。在时间尺度上,2005—2020年玉溪市绿度指标NDVI和湿度指标Wet均呈现先下降后持续增长的趋势,2020年NDVI平均值高达0.79,植被覆盖状况显著改善; 干度指标NDBSI呈上升—下降—上升的波动趋势,但干度指标均值总体下降; 热度指标LST波动趋势与RSEI呈反比,2015年出现低值0.31。16 a间玉溪市生态环境质量呈现出下降—上升—下降的趋势,呈“S”型波动,2010年遥感生态指数达到最低点,生态环境质量相比2005年下降10.5%,与柳德江等[22]利用生态足迹分析方法研究玉溪市2000—2009年生态承载力动态变化结果相比,生态环境处于不安全状态具有相似性。
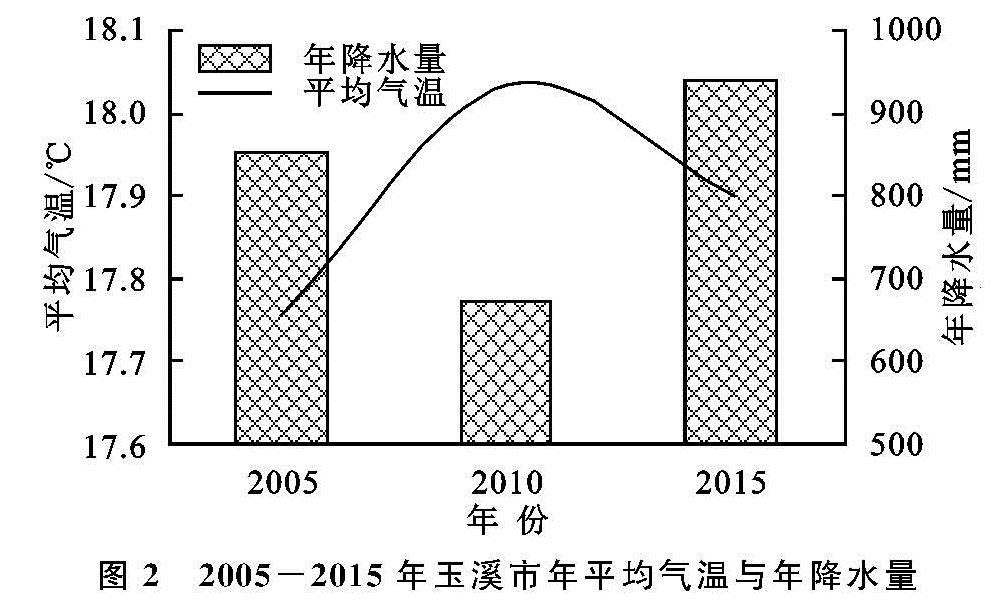
为进一步验证本文计算的各项指标的精度,本文选取2005年、2010年、2015年玉溪市年降水量和年平均气温(图2)。2005—2015年玉溪市年平均气温呈倒“U”型波动,从17.76℃上升到17.9℃,年降水量呈先下降后上升的趋势,由2005年的852.3 mm上升到2015年的938.7 mm。由此看出,2005—2015年玉溪市年平均气温与热度指标LST、年降水量与湿度指标Wet变化趋势基本一致。《玉溪市土地利用总体规划(2006—2020年)》[23]中提到,玉溪市2006—2020年农用地面积增长473.61 km2,其中林地面积占58.3%,说明玉溪市植被覆盖率有所上升,这与本文绿度指标NDVI变化规律基本一致; 新增建设用地89.67 km2,但自然保留地面积下降563.28 km2,说明建设用地小面积增加的同时自然保留地大面积减少,侧面反映出建筑指数IBI的小幅增加和裸土指数SI大幅下降,最终导致干度指标NDBSI小幅度下降,这与本文计算结果基本吻合。
图2 2005-2015年玉溪市年平均气温与年降水量
由表2可知,从整体上来看,2005—2020年玉溪市的RSEI等级主要以中和良为主,不同等级所占比例分别为40.65%,48.64%,38.83%,42.61%和46.78%,33.96%,49.81%,40.97%,尤其在2015年两者占比之和高达88.64%,差和优的占比较小,因此玉溪市的生态环境质量处于中等状态; 从单一年份来看,2005年和2015年生态环境状况较好,优、良、中占比之和高达90%以上,差和较差占比很小,分别为0.06%,6.46%和0.01%,4.6%。2010年较差和中所占比例达到最高,分别为16.67%和48.64%,生态环境状况相对较差。2020年,差和优占比仍然较低,中占比适中,良所占面积下降较多; 从变化情况来看,2005—2020年,差所占比例呈现上升—下降—上升的趋势,所占面积总体上升,但比例不大; 较差和中所占比例同样呈现上升—下降—上升的趋势,但比例较大且均在上升,上升幅度分别为6.83%和1.96%; 然而良和优所占比例呈现出与中和较差等级相反的变化趋势,所占面积分别减少了857.75 km2和448.68 km2,说明RSEI等级由良和优向中和较差等级转移。综上所述,玉溪市在快速发展城市化进程中对生态环境的保护力度不够,导致生态环境质量有所下降。
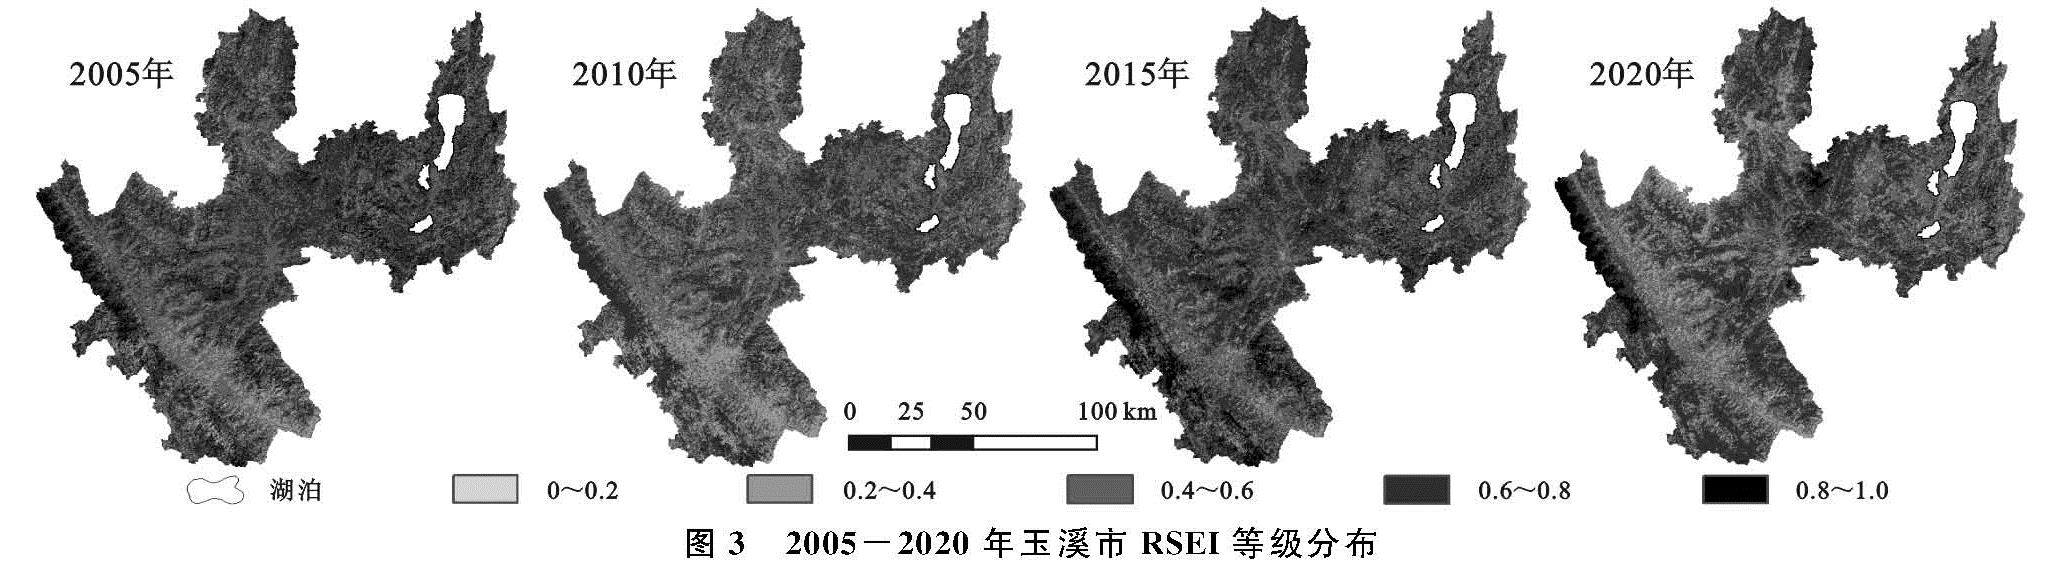
从空间分布格局看(图3),RSEI等级为差和较差的区域主要分布在玉溪市的西南部,即元江县境内。元江县是云南三大火炉之一,也是我国最为典型的干热河谷,常年高温少雨,水土流失严重,是导致生态环境质量较差的主要原因; 而等级为优的区域主要分布在哀牢山,生态环境质量较好,其主要原因是哀牢山为国家级自然保护区,其森林覆盖率高达85.1%,生物种类繁多,生态系统较为稳定。RSEI等级为中和良的区域在全市境内均有分布,且分布面积较广。2005—2010年,RSEI等级为优和良的区域显著减少,等级为中和较差的区域明显增多,生态环境急剧下降,其主要原因是2010年大旱,降雨减少,温度上升,造成某些地区植被大面积死亡。2010—2015年,RSEI等级为差、较差和中的区域向等级为优和良转移,说明生态环境质量得到明显改善。2015—2020年,生态环境质量变化呈现出与2010—2015年相反的趋势,玉溪市生态环境质量出现局部恶化,北部和西南部地区尤为明显。总体上来看,16 a来玉溪市RSEI等级为优和良的区域减少,等级为中、较差和差的区域增多,研究区生态环境质量略有所下降。《玉溪市土地利用总体规划(2006—2020年)》[23]指出,2006—2020年玉溪市新增建设用地8 967 hm2,大面积建筑用地的增加是生态环境退化的主要原因之一。
2.2 玉溪市生态环境质量的差值分析
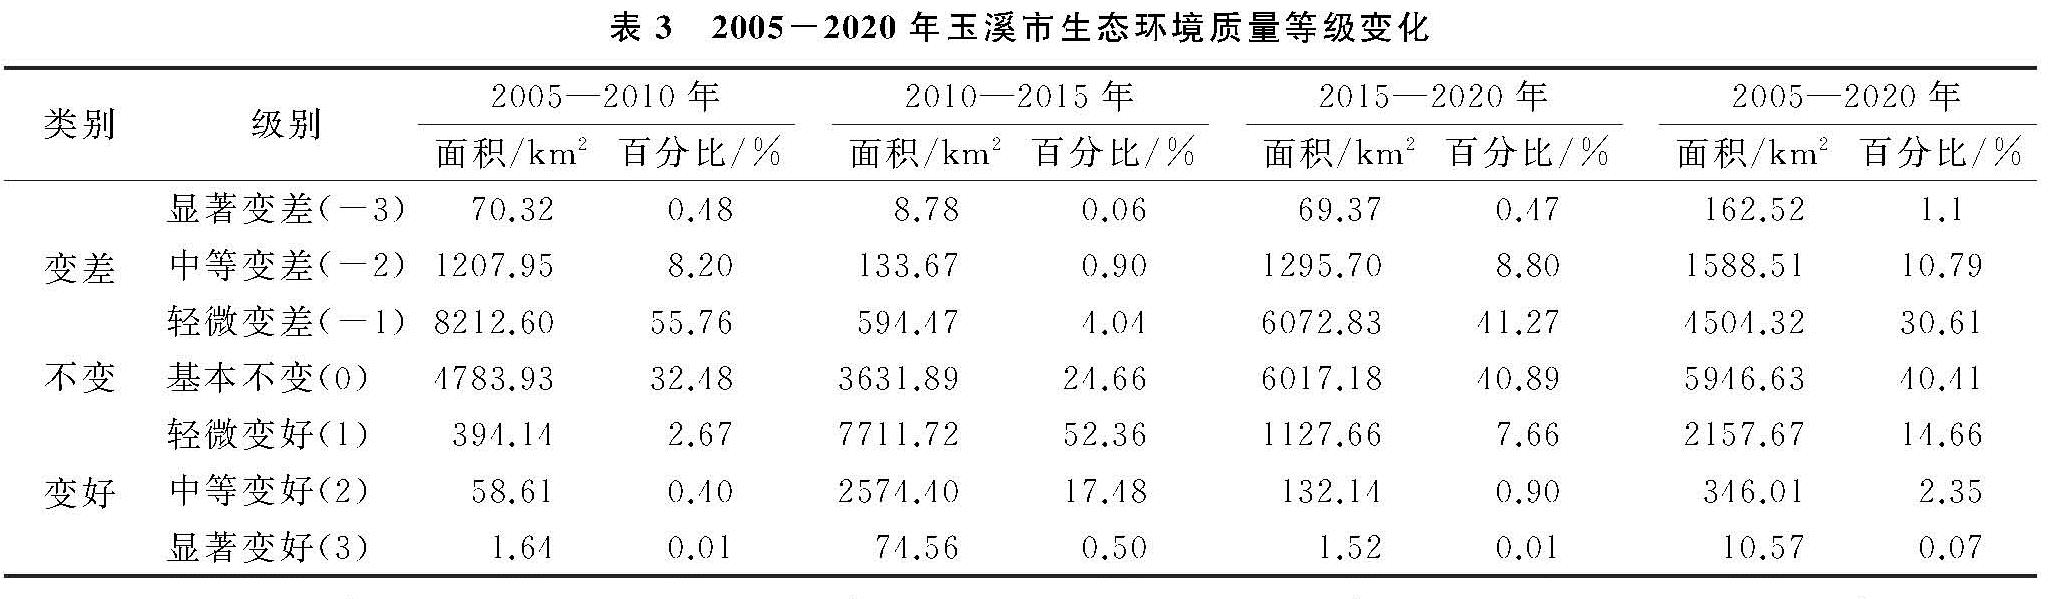
由表3可以看出,2005—2010年玉溪市生态环境状况变好的面积为454.39 km2,占总面积的3.08%,而生态环境状况变差的面积为9 490.87 km2,占总面积的64.44%,其中,以降低1个等级为主。由此可见,玉溪市在2005—2010年生态环境质量有所下降,部分地区生态环境遭到了一定的破坏,因此需在治理生态环境质量差和较差区域的同时应该兼顾对生态环境的保护; 2010—2015年,生态环境状况变好的面积为10 360.68 km2,占总面积的70.34%,其中,以增加一个等级为主,变差的面积为736.92 km2,占总面积的5%。与前一阶段相比,变好面积增加,变差面积减小,生态环境质量呈现持续好转态势。说明玉溪市在城市化进程中对生态环境的保护越来越重视,并且取得了一定的成效; 2015—2020年,生态环境状况变好的面积为1 261.32 km2,占总面积的8.57%,变差的面积为7 437.89,占总面积的50.54%,其中下降一个等级的占总面积41.27%,生态环境状况出现了大面积的小幅降低。总的来说,玉溪市生态环境质量2005—2020年呈现出“下降—上升—下降”的趋势,总体生态环境质量小幅度下降。
从空间变化情况看(图4),2005—2010年玉溪市生态环境质量呈显著下降趋势,全市生态环境质量呈不同程度退化,但东部及西南部退化尤为明显; 2010—2015年,玉溪市生态环境得到了很大改善,但抚仙湖、星云湖、杞麓湖三湖流域及红塔区生态环境质量出现小面积退化; 2015—2020年,玉溪市生态环境质量略微下降,不变区域面积较大,显著变差区域主要集中在玉溪市西北部及东部三湖流域。总的来看,玉溪市2005—2020年生态环境质量略微下降,变差的区域超过了总面积的40%,主要分布在东部三湖流域、新平县西北部及红塔区,玉溪市中部和西南部生态环境质量有所改善。《玉溪市城市总体规划(2011—2030)》[24]明确指出玉溪市七县两区的发展规划,城市化发展是必然趋势,不透水面面积的增加导致了生态环境的恶化。
表3 2005-2020年玉溪市生态环境质量等级变化
2.3 讨 论
2.3.1 遥感生态指数敏感性分析
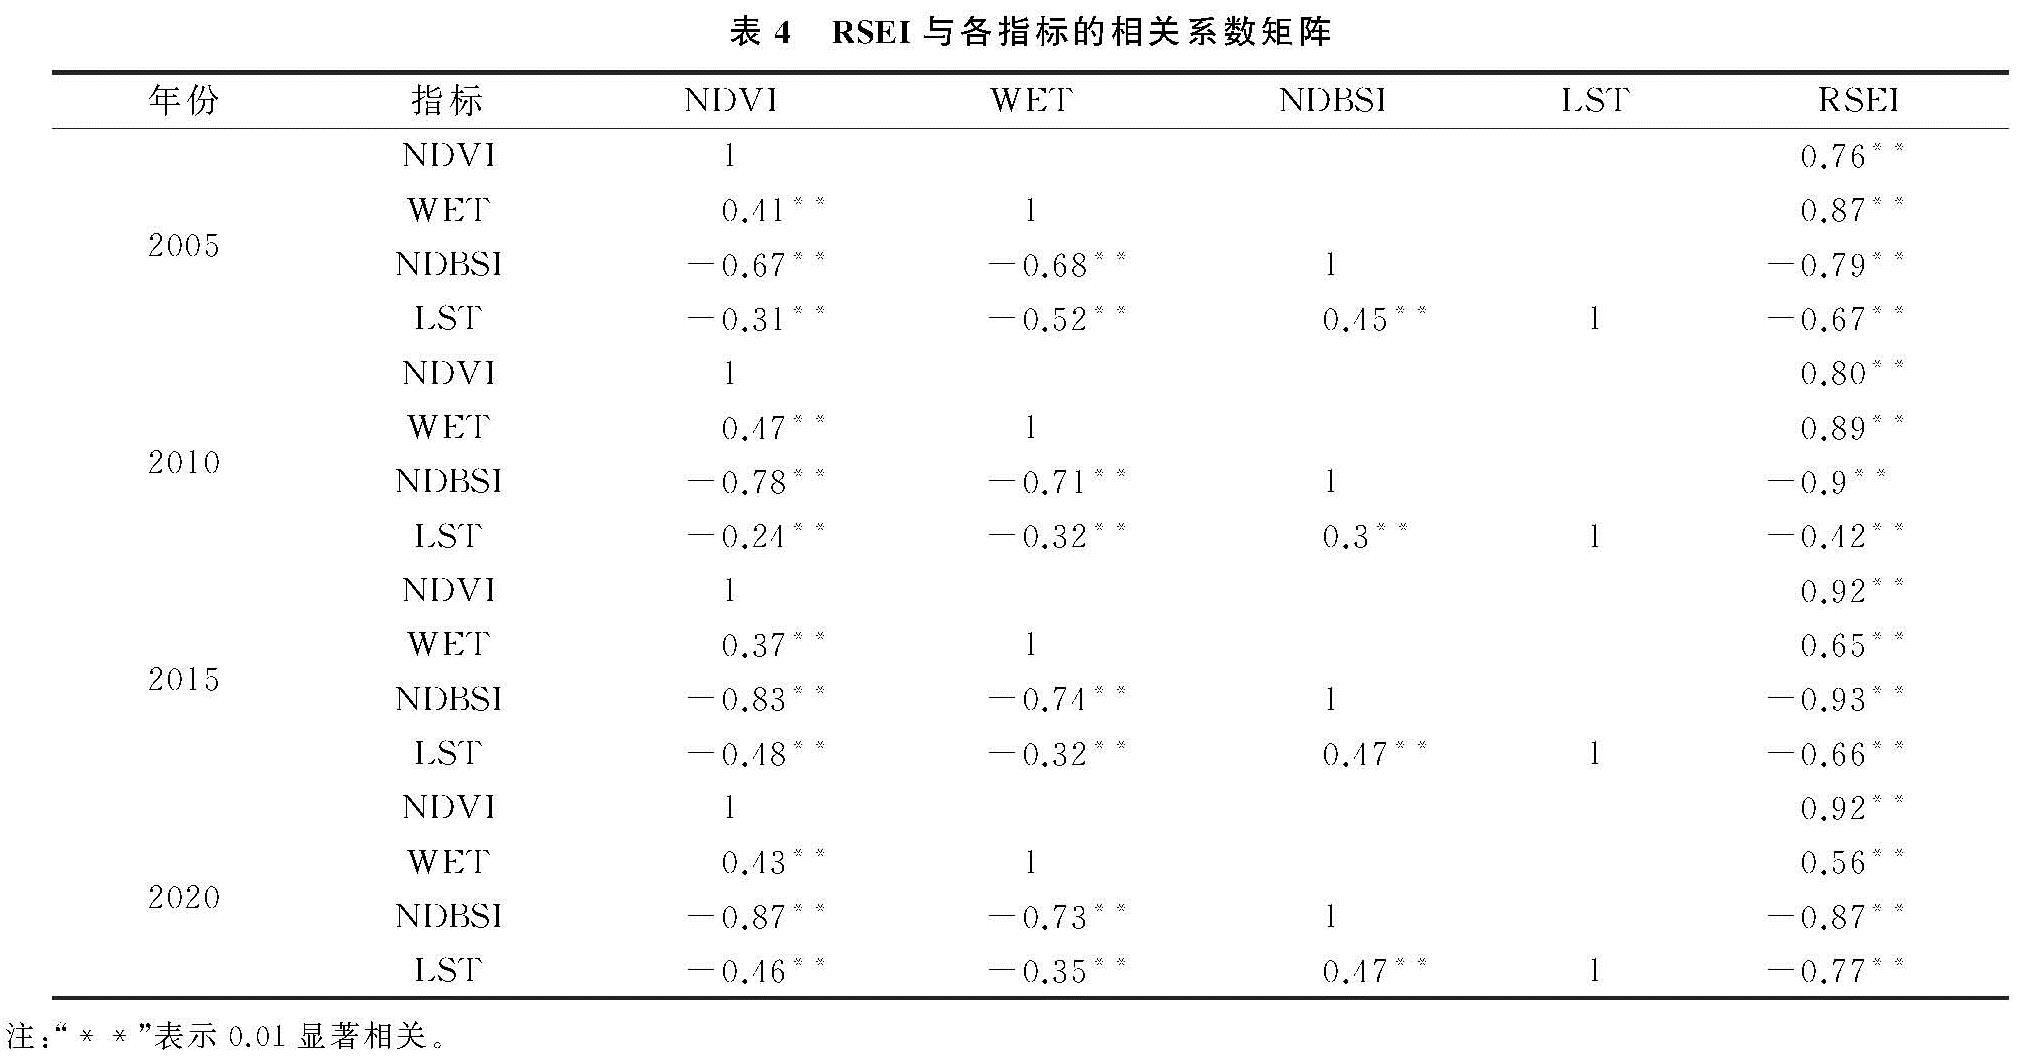
表4为各指标与遥感生态指数之间的相关性。由表4可以看出,2005—2020年,NDVI,WET,NDBSI,LST之间平均相关度最高的是干度指标NDBSI,4个年份的均值为0.64; 平均相关度最低的是热度指标LST,4个年份的均值为0.39。4个年份的RSEI与4个指标的相关系数均值为0.77,比单指标相关度最高的干度分量高0.15,比最低的热度分量高0.38,比4个指标的平均值(0.52)高0.25。由此可见,RSEI与各指标之间敏感性较强,可构建RSEI模型来综合反映玉溪市生态环境状况。
2.3.2 遥感生态指数适用性分析
为了分析各年份各指标参数与RSEI的关系,以RSEI为因变量,以NDVI,WET,NDBSI,LST为自变量进行逐步回归分析,建立关系模型。本文采用3 km×3 km网格贯穿全影像的采样方法,每幅影像采集10 000个样点,足够多的样点可以避免少量样点所带来结果的不确定性。以下是4个年份的回归模型(模型均通过了1%的显著性检验):
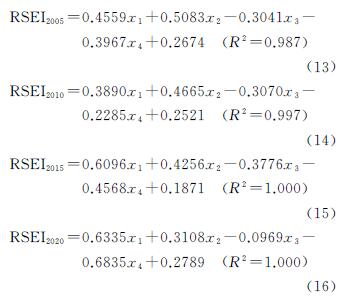
式中:x1,x2,x3,x4分别代表NDVI,WET,NDBSI,LST的值。
从各年份回归模型中回归系数的绝对值可以看出,NDVI对遥感生态指数的贡献度最大,其次是WET,LST,NDBSI。其中NDVI和WET系数为正,说明对RSEI起正向作用,NDBSI和LST系数为负,说明对RSEI起负向作用。在逐年的回归模型中,正向指标中NDVI系数逐年增加,说明植被覆盖在生态质量的提升中愈发重要,而WET所表现出的影响力相对较弱。负向指标中,LST的绝对值大于NDBSI的绝对值,说明LST对生态质量的抑制更为明显,侧面反映出地表温度的上升对生态环境质量的破坏程度越来越大。总的来说,NDVI系数在回归模型中所占权重最大,说明玉溪市封山育林、植树造林、退耕还林、退耕还草等政策实施结果较为显著。
为了验证上述回归模型的可靠性,以2020年10 000个数据样点为例,构建各指标的三维散点空间分布图来考察各指标与RSEI的关系(图5)。从左图正向指标NDVI,WET的三维空间分布图来看,RSEI高值区主要分布在植被覆盖度较高且水分条件好的区域,说明植被覆盖的增加以及充足的水分对生态环境质量的改善效果明显; 而右图负向指标NDBSI,LST的三维空间分布表明生态环境质量随NDBSI,LST的增加而逐渐下降,RSEI低值区主要集中在高密度建筑区和高地表温度区。综合来看,该结果与上述回归模型结果相吻合,模型的适用性较强。