IPCC第5次评估报告指出,全球大部分地区均呈明显升温趋势,1951—2012年全球地表平均气温增温幅度达0.12℃/10 a,而中国陆地表面平均气温的升温率为0.23℃/10 a,高于全球的升温幅度[1-2]。气候变暖使高温、严寒、洪涝及干旱等极端天气事件的发生日益频繁,强度也越来越大,从而给人类生活、自然环境及经济可持续发展造成严重的影响[3-4]。当前,学者们主要基于不同角度和发生阈值对极端气候事件进行阐释[1,5]。极端气候事件实质上是由于某气象要素的正负异常超出了一定阈值,发生于某一特定地点和时间的气候极值[5]。从单个气象观测点来看,极端气候事件一般采用本站点气候要素(如气温、降水量等)在一段时间内的异常记录或超过特定阈值的天数等指数来表示[5]。全球气候变暖导致极端气候事件发生频率和强度的增加,通常,极端气候事件变率的强度及危害都大于平均气候。近年来,极端气候指数时间序列的研究已成为气候变化研究的热点问题,许多学者基于不同的方法和角度对区域极端气温事件的变化特征进行了大量的研究[5-7]。You等[8]研究了中国极端气温的变化特征,发现北方地区极端气温的变化幅度比较明显。黄小燕等[9]利用1960—2013年中国沿海110个气象观测站气温资料,分析了中国沿海极端气温事件的变化特征。刘青娥等[10]研究了珠江流域极端气温的时空变化规律,并选取7个影响因子来分析极端气温变化的环流背景成因。中国领土辽阔,地理位置、地形起伏及下垫面状况的区域差异使得不同地区的气候条件存在明显差异,因此探讨区域范围极端气温指数的变化趋势也显得非常重要。目前,已有学者对贵州、河南、山东和辽宁等中国局地地区的极端气温事件进行了研究和分析[11-14],结果表明各地区极端最低气温总体上均呈增加趋势,不同区域增加幅度差异显著。
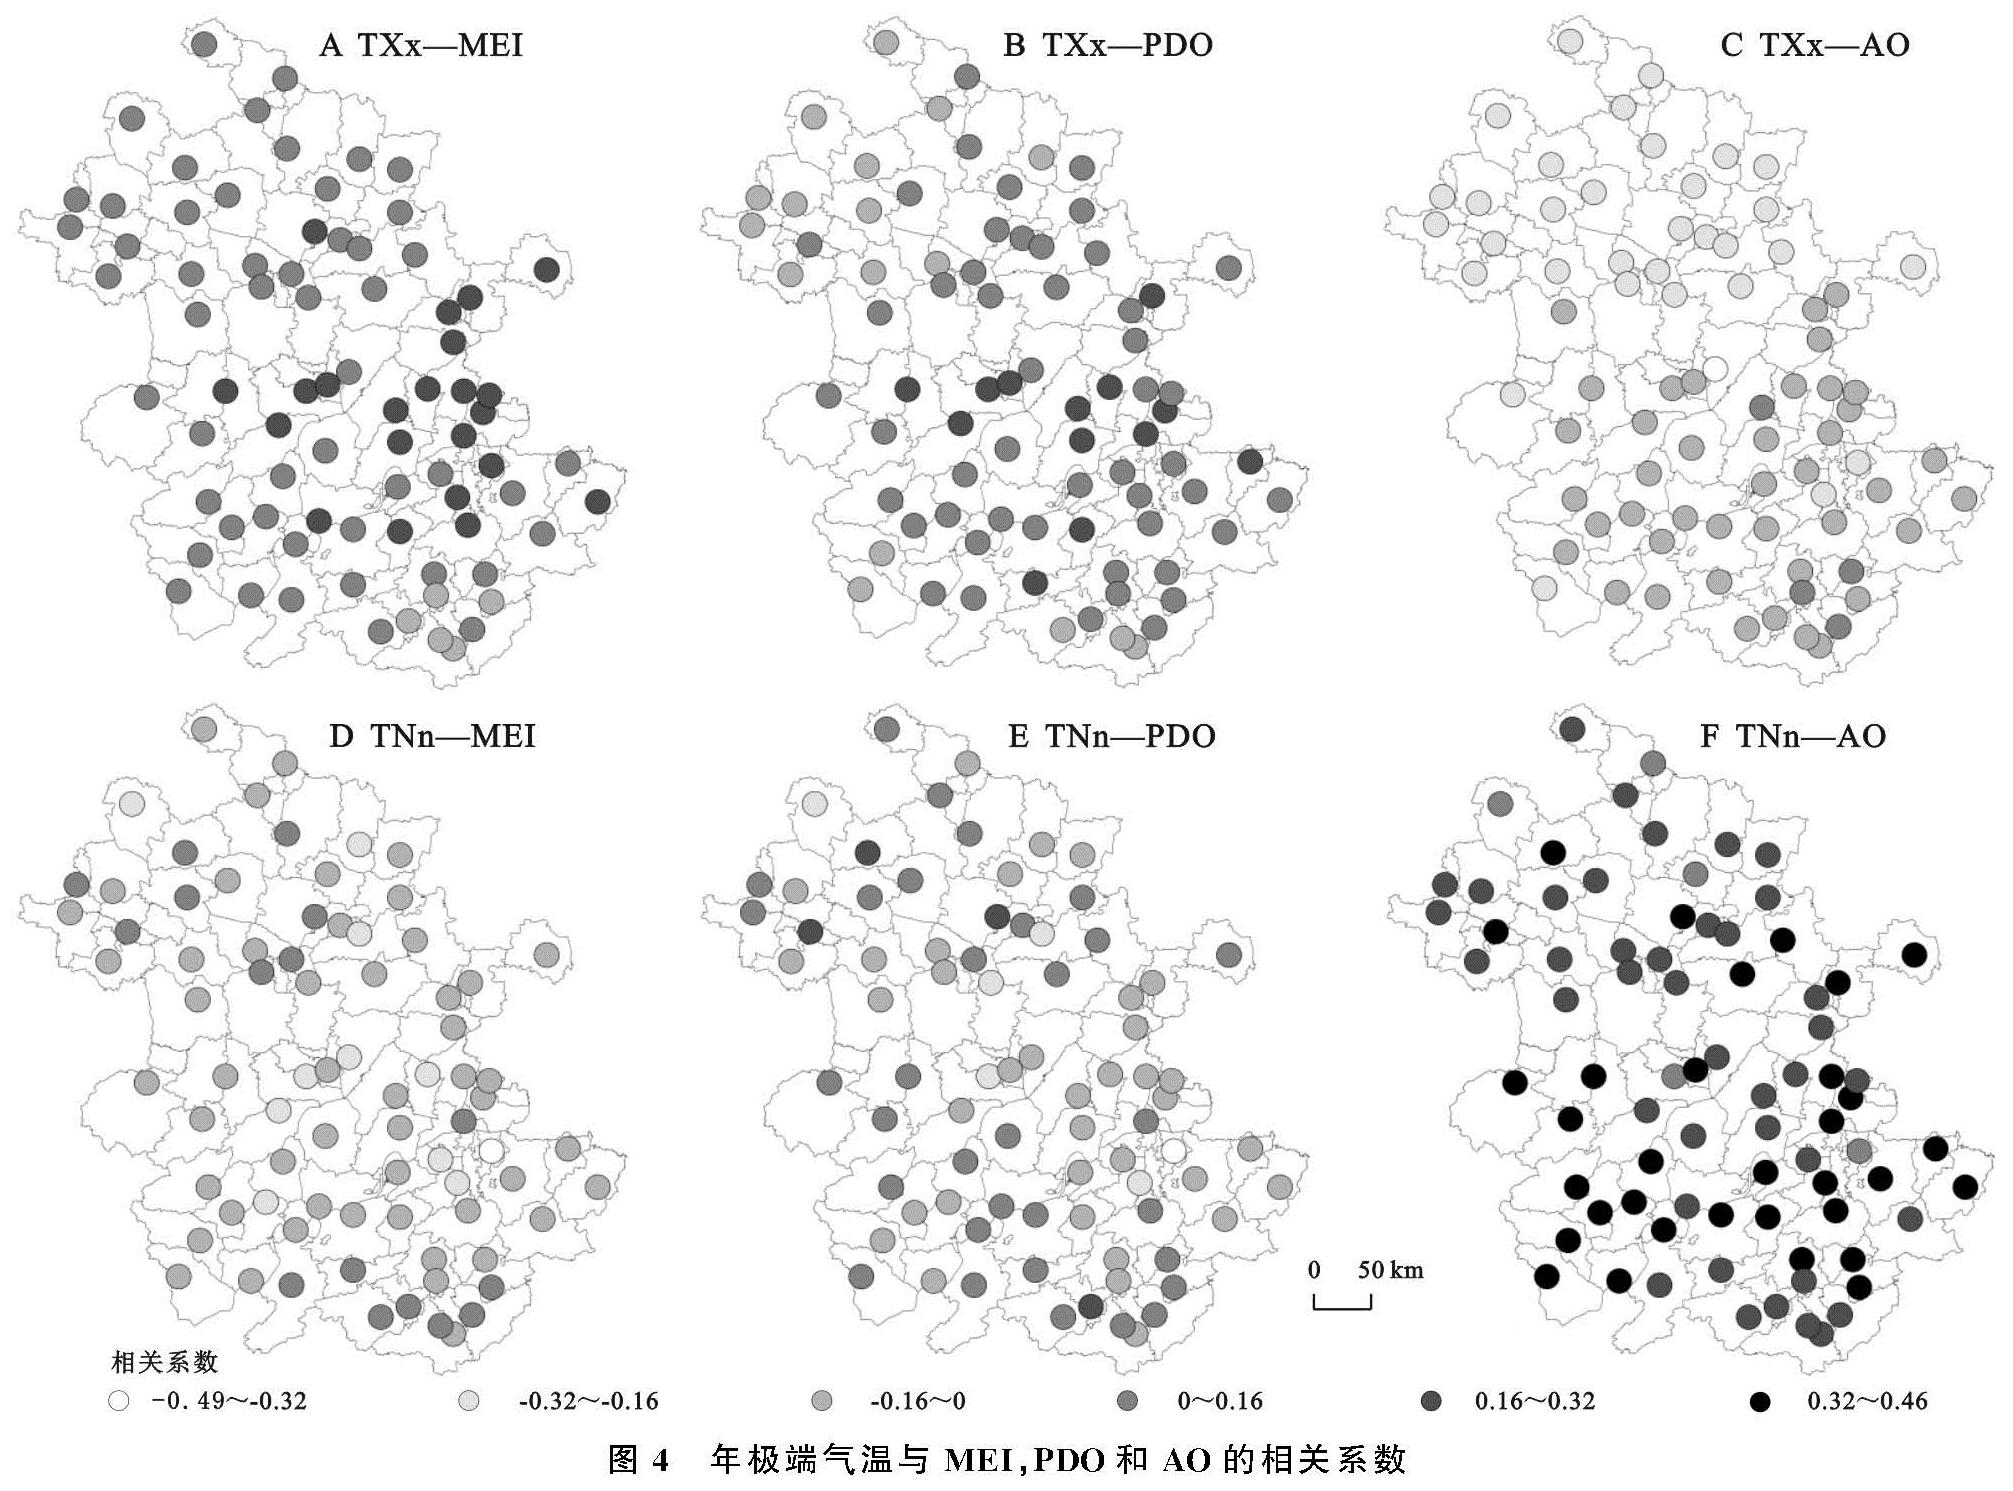
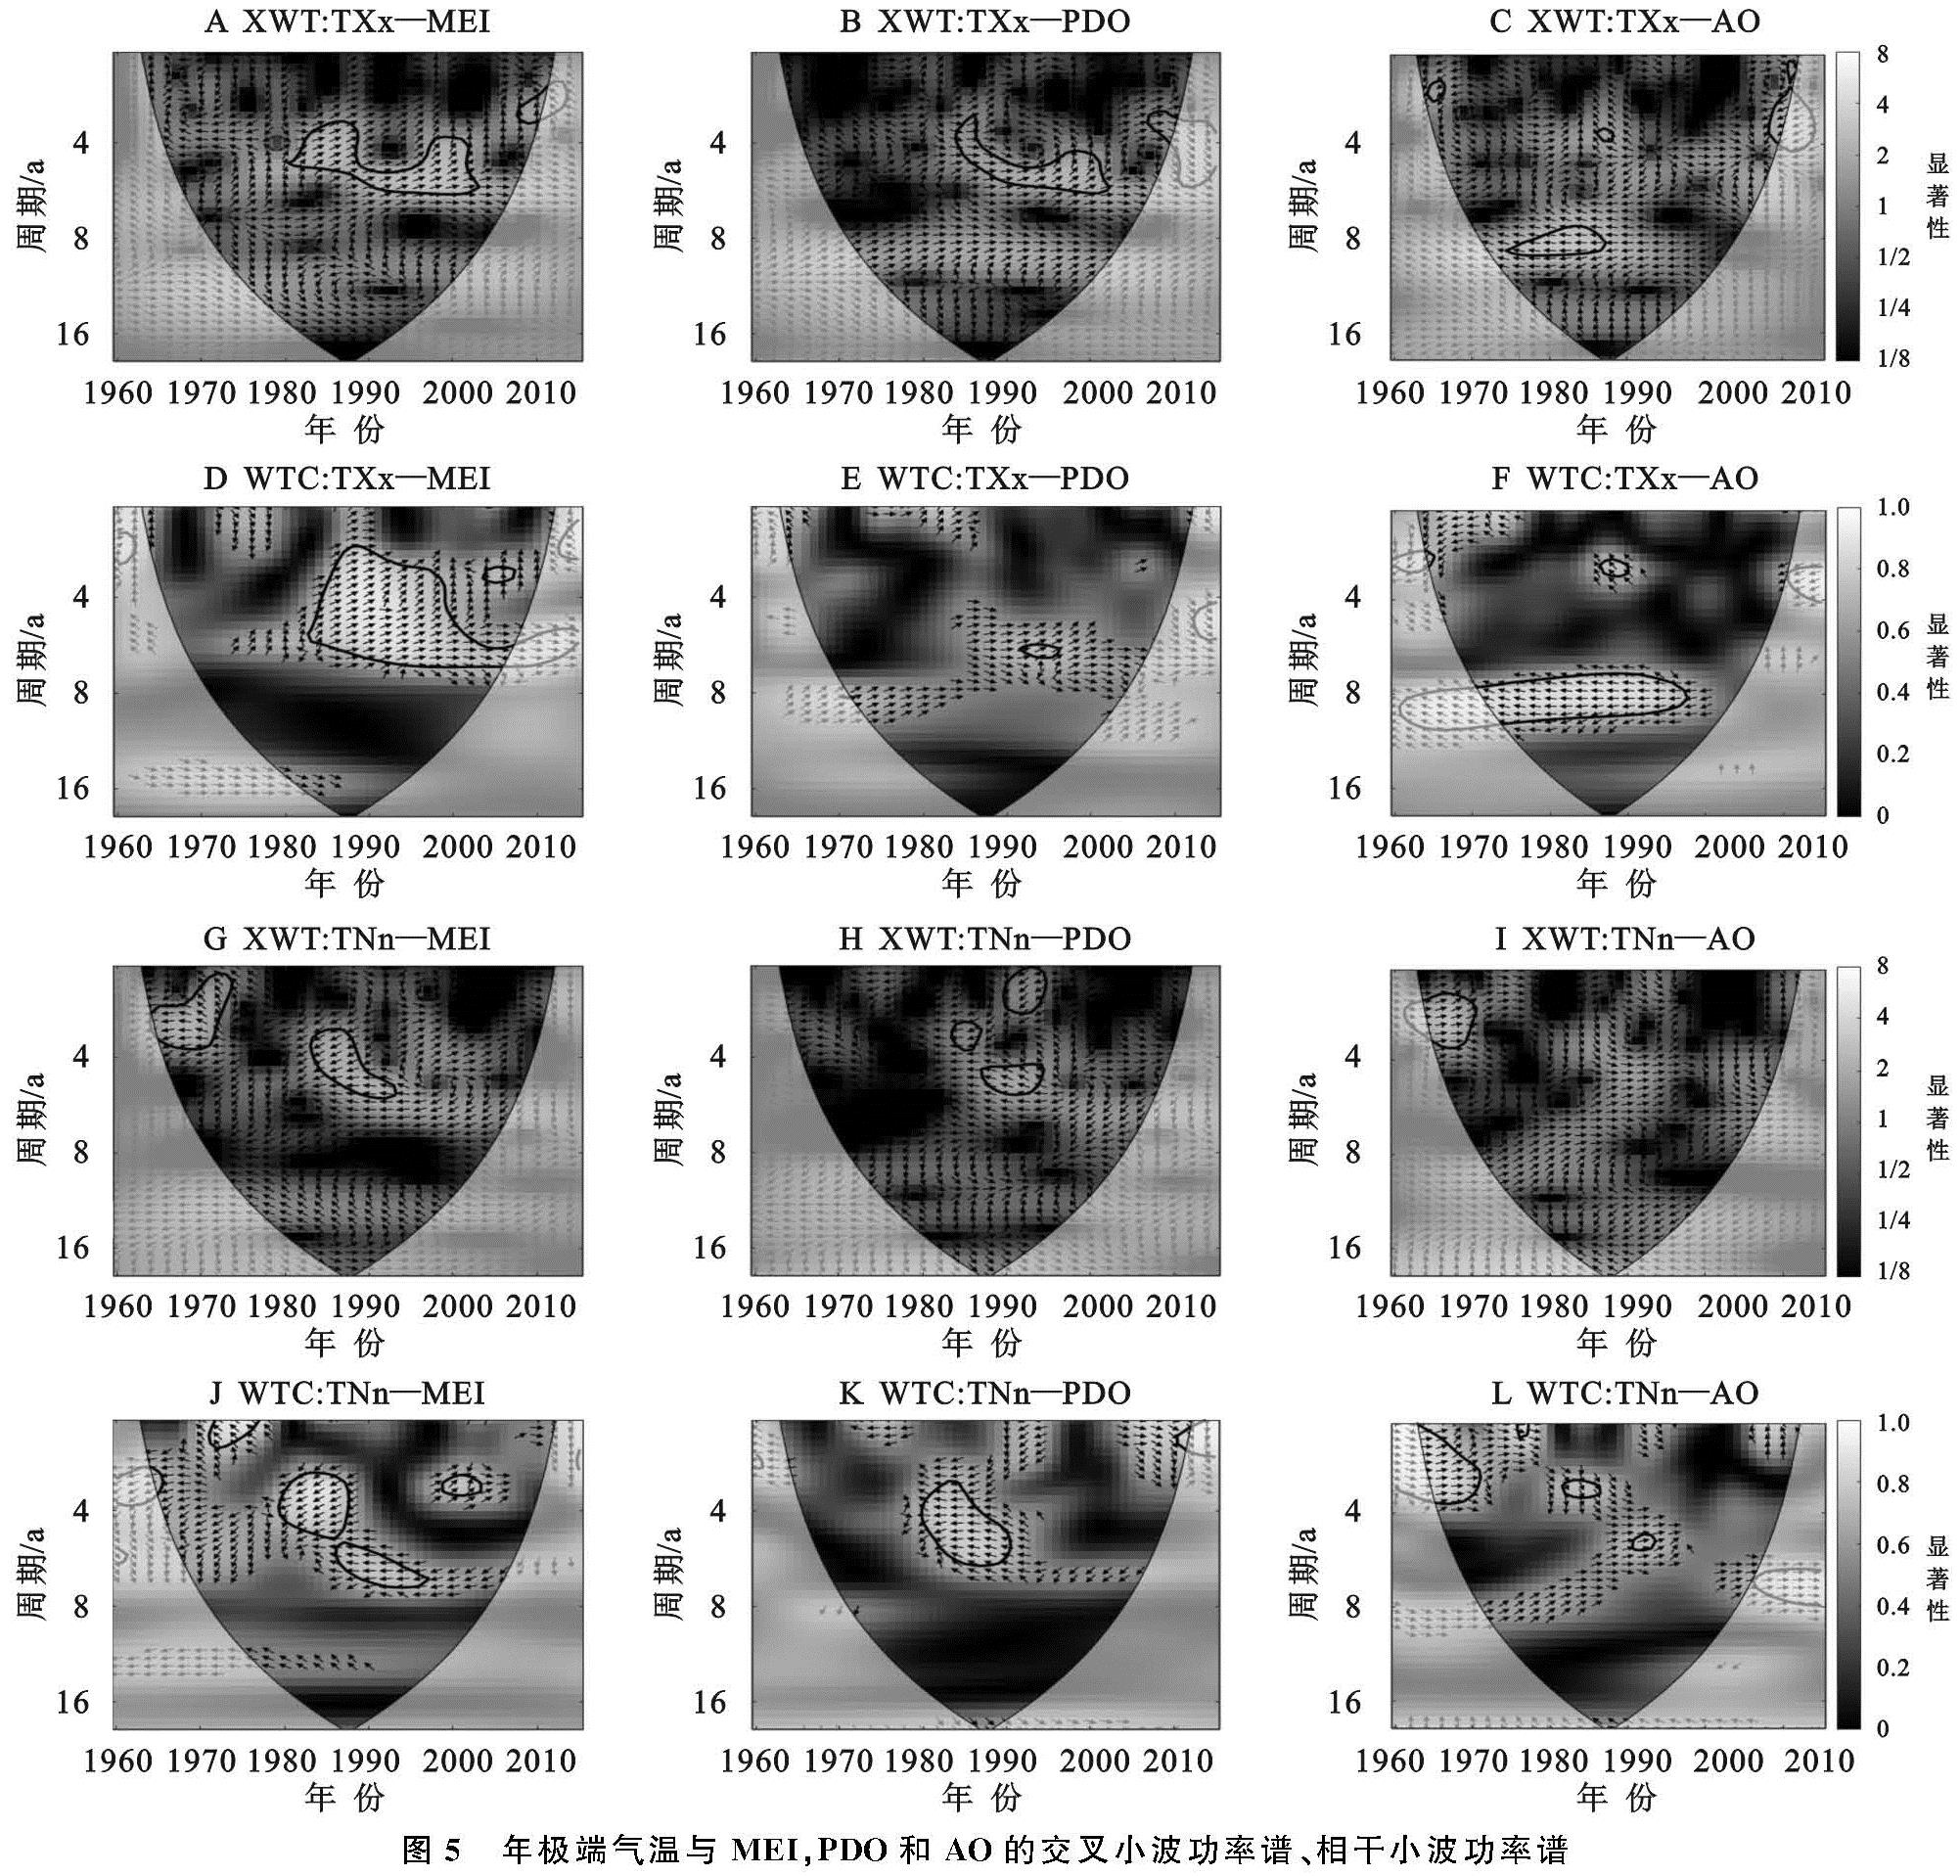
海气耦合是影响大气环流和气候变化的重要因素,尤其是发生在热带太平洋的厄尔尼诺—南方涛动(El Niño-Southern Oscillation,ENSO)、北太平洋年代际振荡(The Pacific Decadal Oscillation,PDO)和北极涛动(The Arctic Oscillation,AO)现象与全球气候异常具有密切联系[15-16]。相关研究发现ENSO,PDO和AO是通过大气环流以遥相关形式影响太平洋副热带高压和东亚季风环流的强度,间接对中国气候异常产生重要的影响,尤其是赤道中东太平洋的变冷是导致近年来气候变暖减缓的主要因素[17-19]。ENSO,PDO和AO异常相位是造成中国极端气候(降水和气温)事件的重要原因之一,其对极端气候变化的影响方式和强度因时间和区域的不同,而存在一定差异[20-22]。
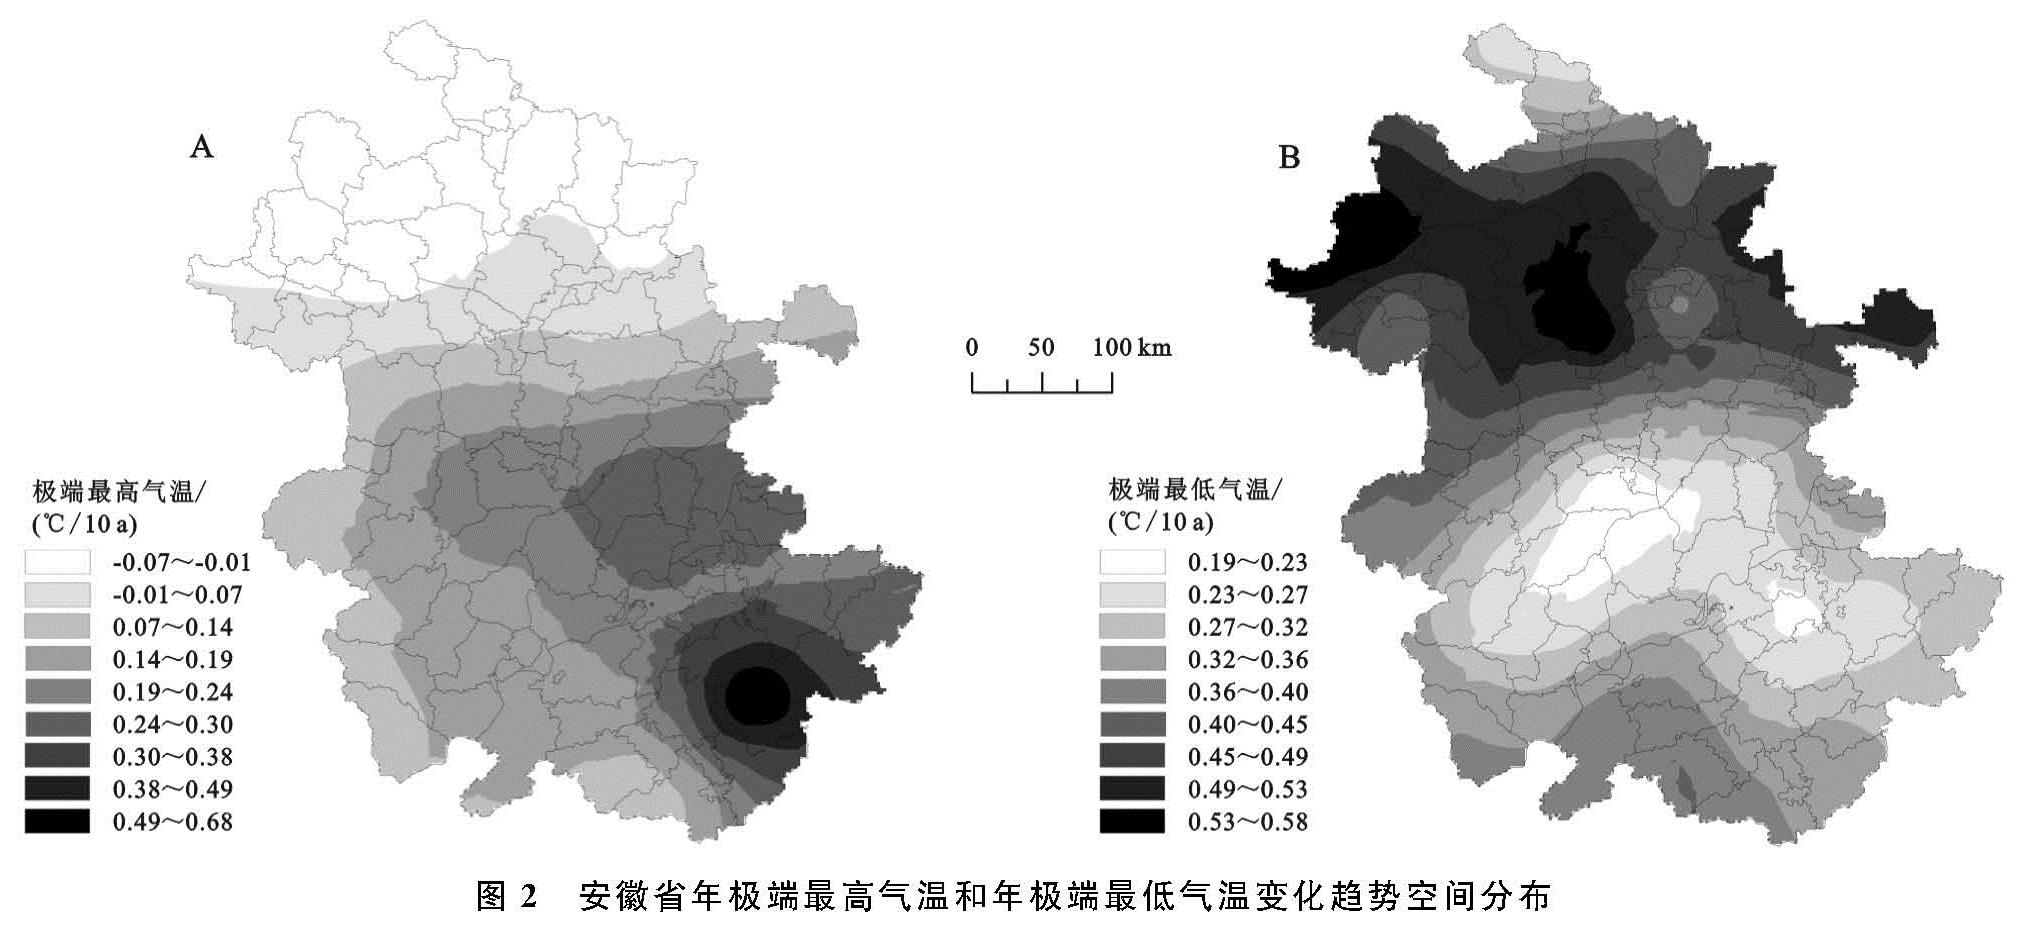
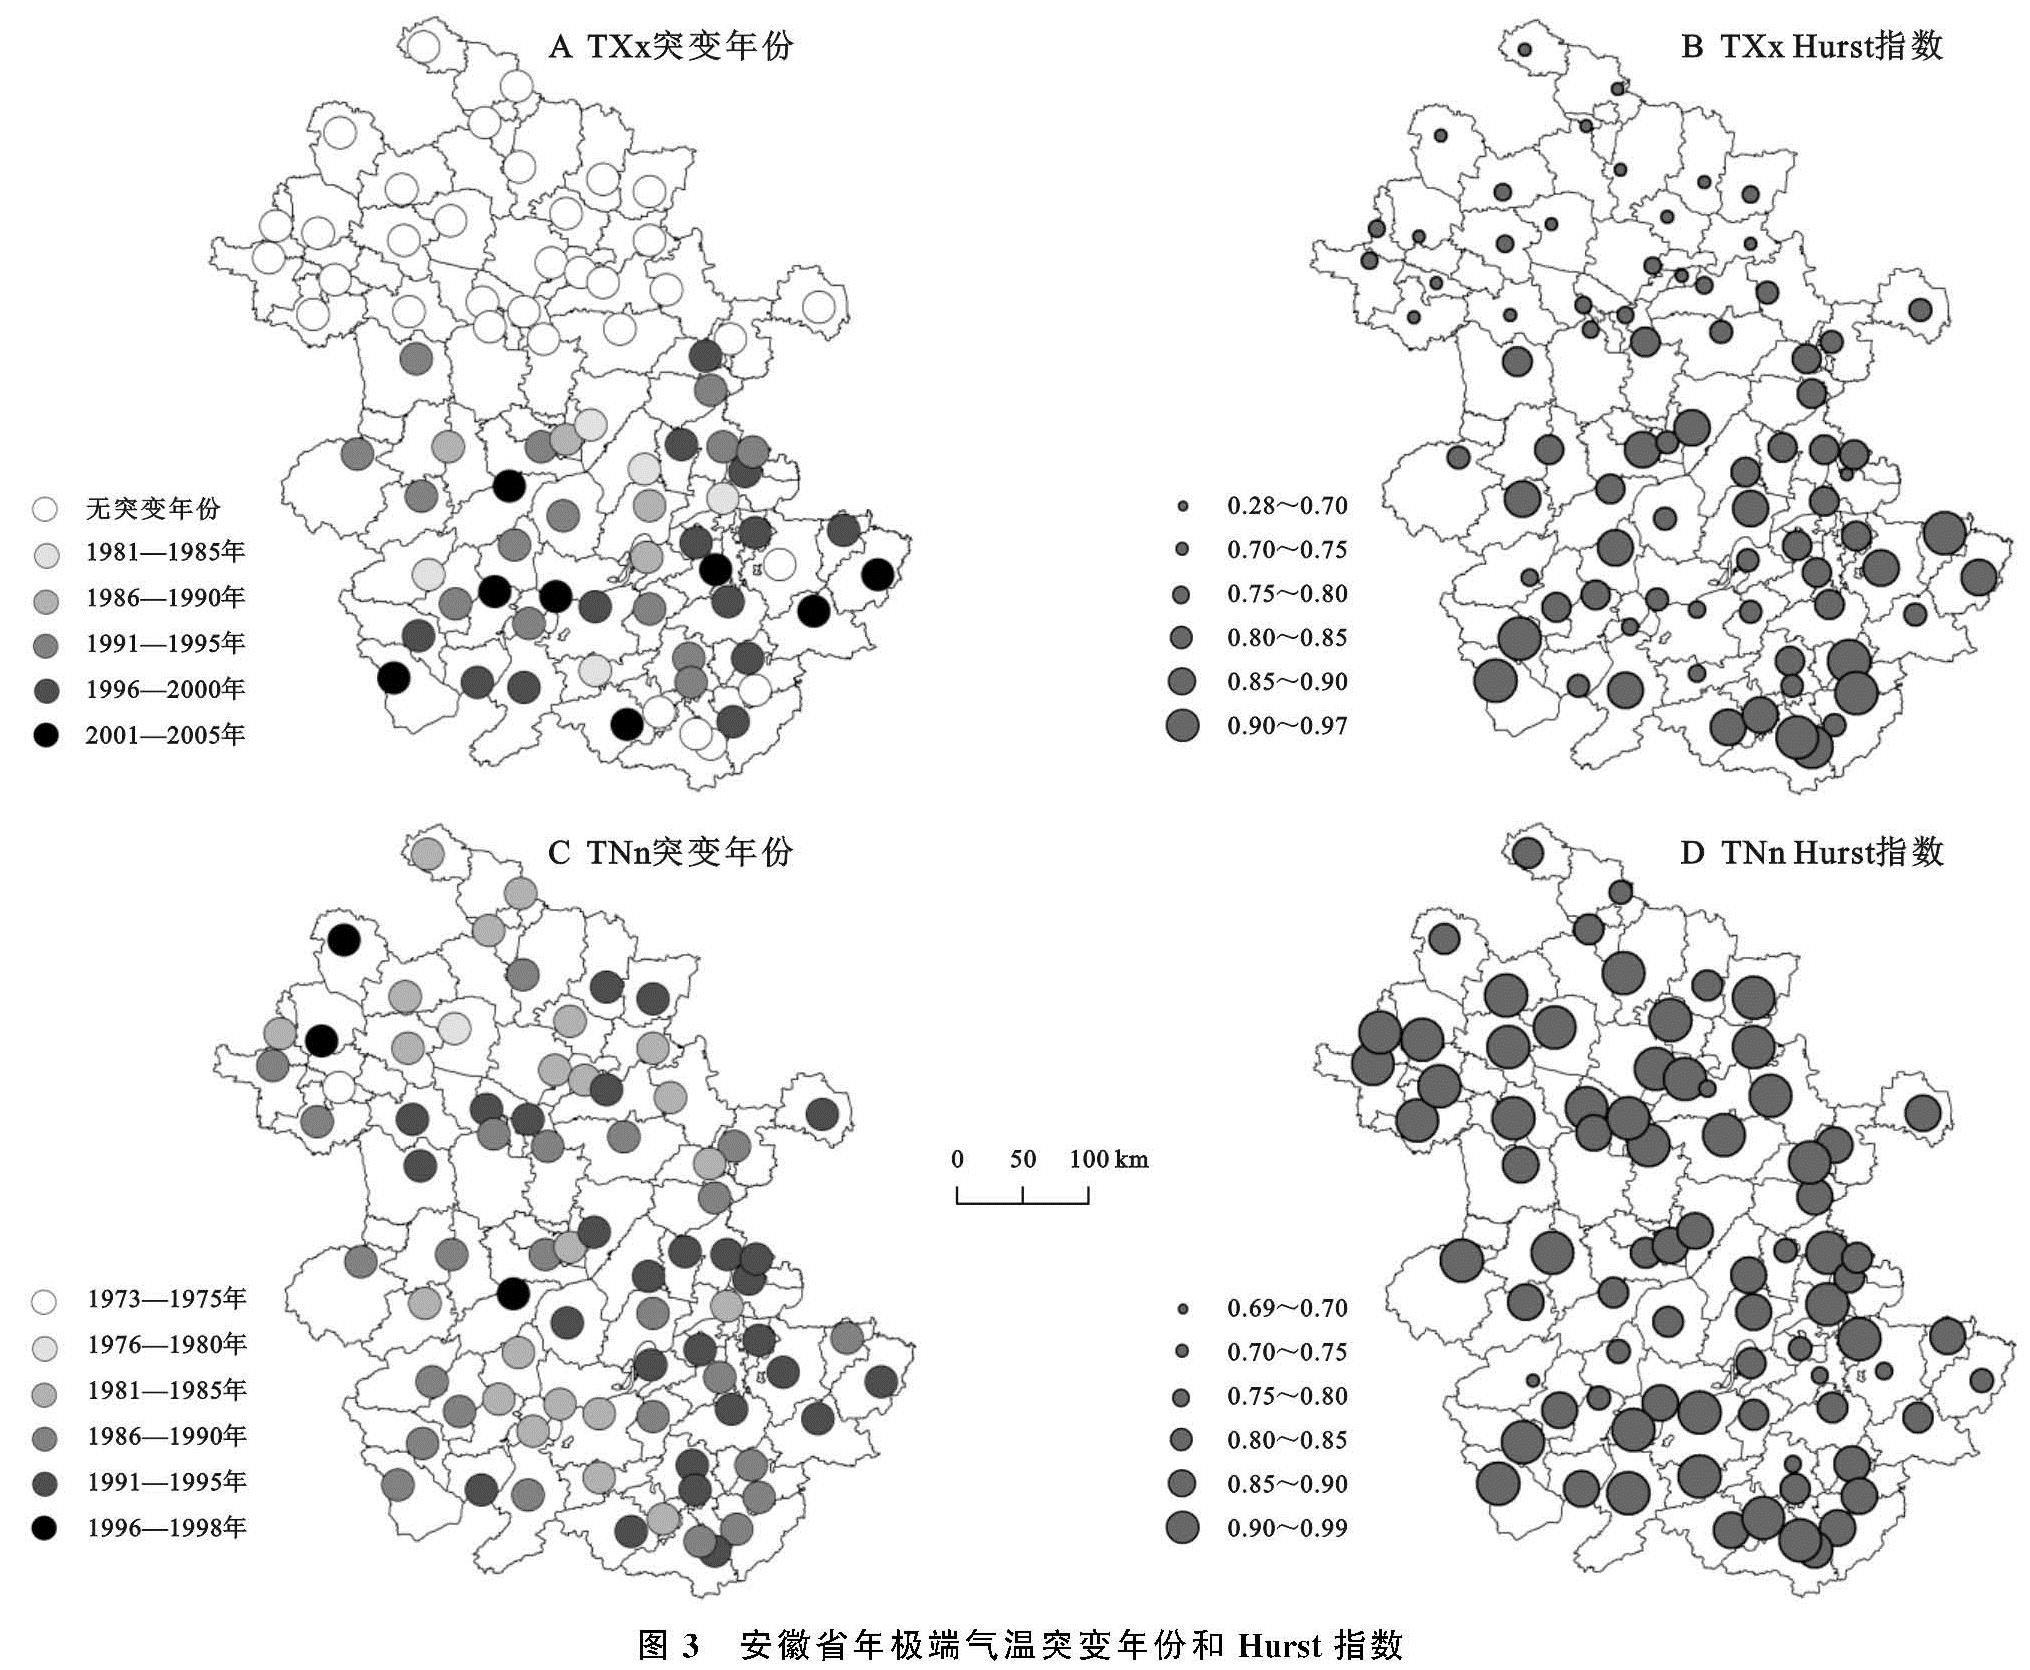
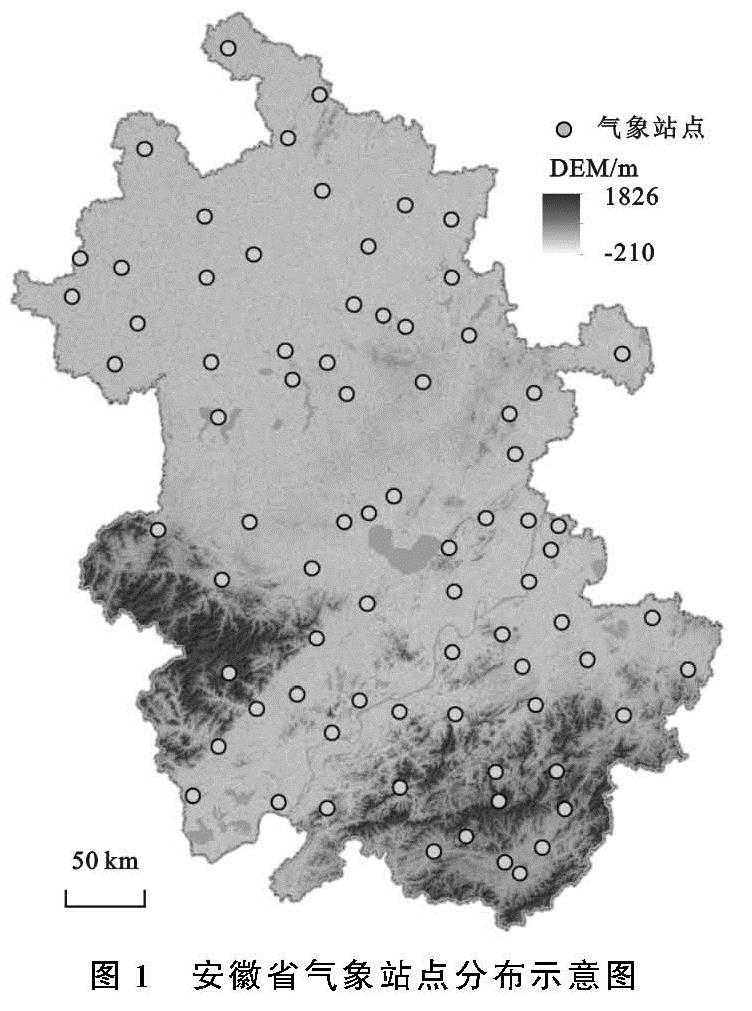
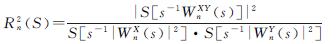
安徽省位于华东腹地(114°54'—119°37'E,29°41'—34°38'N),淮河、长江自西向东横贯境内。省内地貌地形复杂多样,同时又地处亚热带和暖温带过渡区域,位于典型的季风区内。安徽省是国家的重要粮食生产基地,随着极端天气事件的频率增加,继而引发的气象灾害对农业生产和经济发展造成了严重的影响[23]。以往的研究多注重于安徽省气温时空变化特征[24-25],但是安徽省极端气温事件变化特征及其与气候指数(ENSO,PDO,AO)在时频域中多时间尺度相关关系的研究并不多见,且已有研究所用站点数较少,与其他区域气候变化的对比研究不足。在全球气候变化背景下,有必要对安徽省极端气温事件变化趋势及其与气候指数关系进行深入分析,为短期气候预测、调整农业种植结构及防治气象灾害提供参考依据,达到农业和社会经济可持续发展的目的。本研究基于安徽省78个气象站点提供的月值极端气温观测数据,利用线性倾向法、M-K突变检验和交叉小波等方法,探讨1960—2016年极端气温事件的变化趋势及其与ENSO,PDO,AO的相关关系,旨在为深入了解区域极端气温变化研究和合理布局工农业生产提供参考依据。
 (2)
(2)