3.1 土地利用类型变化特征分析
豫西黄土丘陵区主要的土地利用类型为林地、耕地,共占研究区总面积的83%以上。由表1看出,2000—2015年豫西黄土丘陵区土地利用变化较为显著,林地面积占比减少了0.64%,耕地面积占比减少了4.74%有; 草地、建设用地和水域面积不断增加,面积占比分别增加了3.20%,32.77%,45.29%。其中耕地、建设用地的变化最为显著,2000—2015年耕地面积共计减少了554.90 km2,建设用地共计增加了423.70 km2。
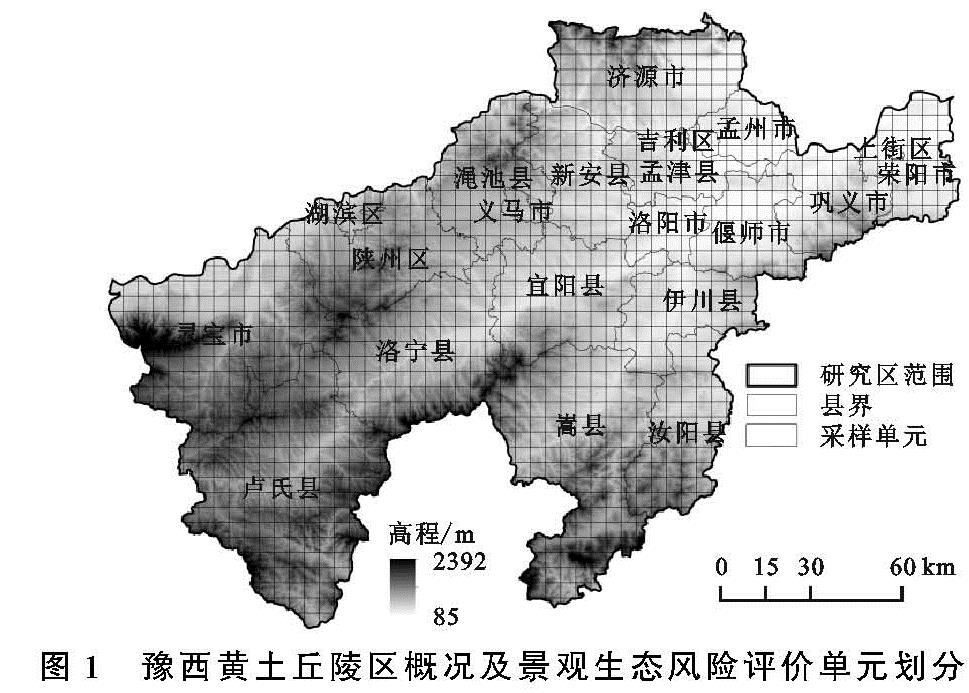
豫西黄土丘陵区林地占比较高,为研究区的优势地类,主要分布于西部的崤山和熊耳山的陕州区、灵宝市、卢氏县、嵩县、汝阳县等区域,在2000—2015年的15 a间,林地面积持续减少,减少面积为184.29 km2,其中2000—2010年林地减少率远大于2010—2015年。园地面积由2000年的40.99 km2增加到2015年的151.93 km2,集中分布在灵宝是、陕州区等区域。草地零星分布于研究区中部和北部区域,2000—2015年草地面积增加了66.51 km2,面积的增加主要集中在2010—2015年。耕地集中分布中部和东部的在涧河流域、伊川临汝盆地、伊洛河盆地等区域,2000—2015年耕地面积大幅度减少,总计减少了554.90 km2,其中2010—2015年耕地面积减少了459.91 km2,变化幅度最大,占耕地减少总量的82.88%。与耕地面积大幅度减少相对应的是建设用地的大幅度增加,2000—2015年建设用地持续增加,总计增加了423.70 km2,2010—2015年建设用地增加率显著高于前一个时期。
表1 2000-2015年豫西黄土丘陵区土地利用变化
利用2000年、2015年两期土地利用图在ArcGIS中进行叠加分析,生成豫西黄土丘陵区2000—2015年土地利用类型变化转移矩阵。由图2可以看出,2000—2015年,耕地是豫西黄土丘陵区土地利用的主要转出类型,耕地与建设用地、林地和园地的转化比较剧烈,转出面积分别为455.66 km2,233.40 km2,138.56 km2,占耕地总面积的比例分别为3.89%,1.99%和1.18%。其次为林地转变为草地、耕地和建设用地的面积分别为181.00 km2,143.40 km2,53.61 km2。近15 a年来,建设用地是豫西黄土丘陵区土地利用的主要转入类型,增加面积表主要来源耕地和林地,城市空间扩展、交通设施建设与农业产业结构调整是建设用地增加与耕地减少的主要原因。
图2 2000-2015年豫西黄土丘陵区土地利用转换特征
3.2 景观生态风险空间自相关分析
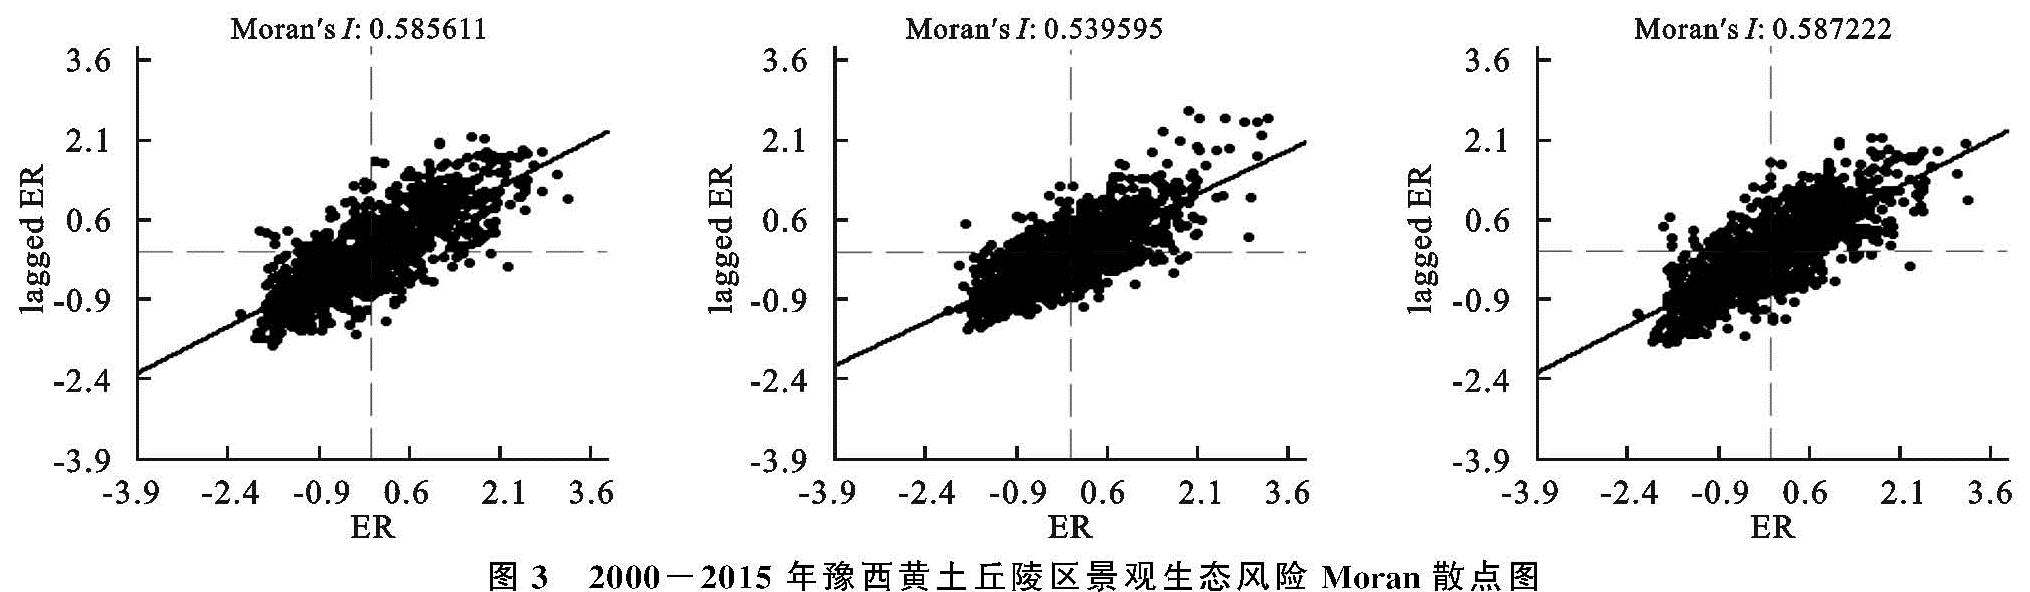
空间自相关分析是检验某一要素与其邻近范围是否具有关联以及关联度,全局空间自相关可以表征某一要素在整体范围内的空间依赖程度,而局部空间自相关表征一个采样单元与其相邻单元的相似程度,能够更直观体现某一要素在空间上的的聚集特征。本研究通过生态风险指数构建模型计算得到研究区2000年、2010年、2015年3期生态风险指数,利用空间计量软件(GeoDa)进行空间全局和局部自相关分析。由图3看出,研究区2000年、2010年、2015年3期生态风险指数全局自相关系数分别为0.587,0.586,0.540。Moran's I指数为正值,表明研究区生态风险呈现正相关关系,生态风险出现聚集区,高等级风险区周围分布着相应高等级的风险,低等级生态风险区周围风险等级也较低。全局自相关值呈现上升的趋势,表明研究区2000—2010年生态风险区聚集趋势变化不明显,2010—2015年呈现减弱的趋势。
图3 2000-2015年豫西黄土丘陵区景观生态风险Moran散点图
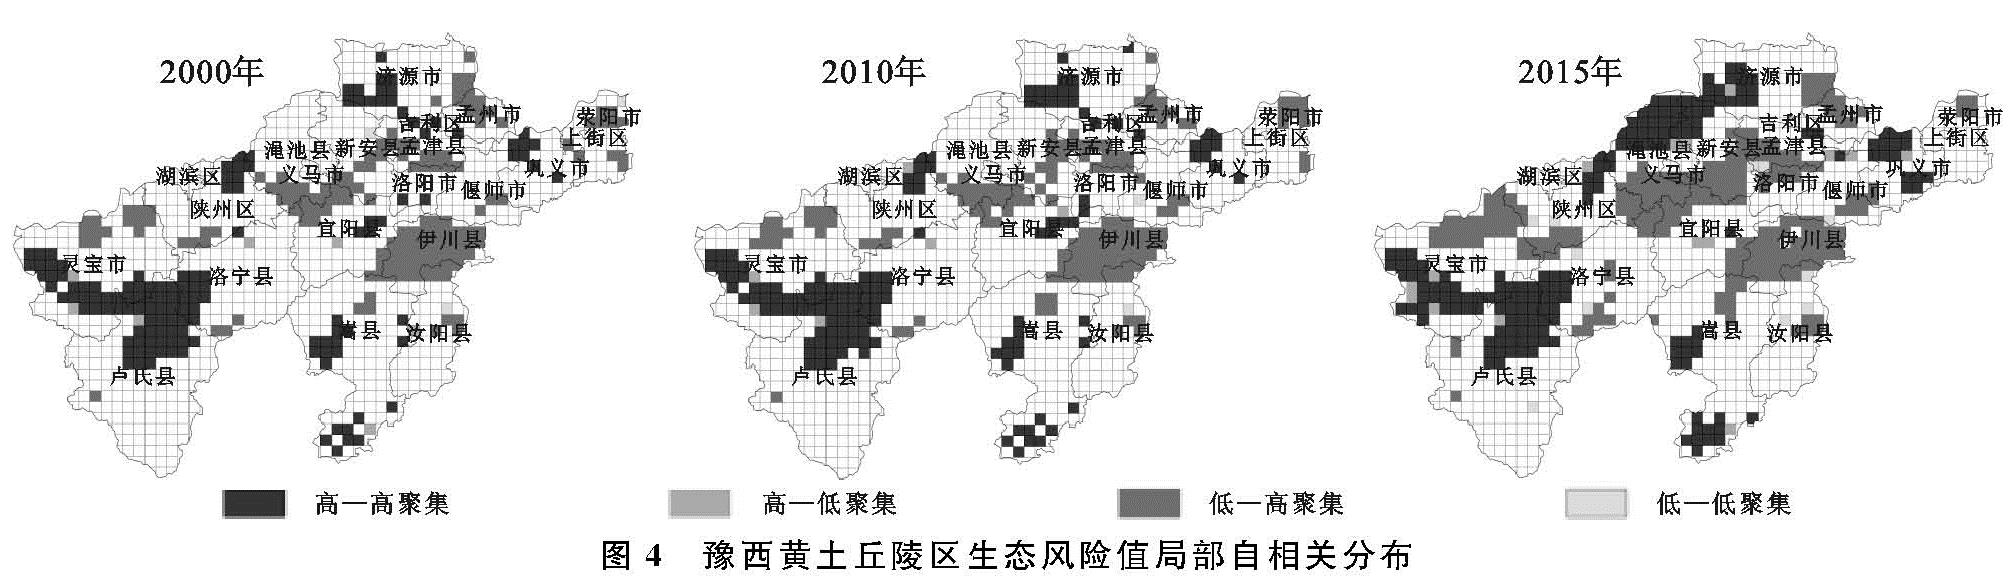
Moran's I指数仅可以反映区域空间分布状态及空间聚集指数,并不能完全表现生态风险在空间上的相互联系程度,利用局部自相关分析(LISA)来探讨豫西黄土丘陵区生态风险在区域上的关联度及其空间集聚特征。通过GeoDa软件对研究区1 096个采样区2000年、2010年、2015年3期生态风险进行LISA分析,得到3期生态风险局部自相关LISA结果(图4)。研究区生态风险值的空间集聚形态主要以低—低集聚和高—高集聚为主。3个时期低—低集聚样区分别占总采样数的13.75%,13.84%,20.49%,高—高集聚样区分别占总采样数的12.91%,12.91%,16.18%,低—高集聚和高—低集聚区占总采样数的0.94%,0.75%,2.71%。从研究区局部自相关情况来看,低—低集聚区域呈现增加趋势,高—高集聚区域呈现先增加后减少趋势。从空间分布来看,生态风险高值集聚区(H—H)主要集中分布在卢氏县—洛宁县—灵宝县,这一区域属于黄土覆盖低山区,地表覆盖类型多样,景观优势度较低且景观分布破碎,人类活动强度的增加极易引起水土流失、林草退化等生态环境问题。其次,高—高集聚区(H—H)也少量分布在城市的建成区及周边地区,这些区域受人类活动影响大,土地利用转换和利用强度高。生态风险低值集聚区(L—L)主要集中分布在伊川县、孟津县、新安县、义马市等区域,这些区域主要位于伊川临汝盆地、黄土台地丘陵区,景观类型以耕地为主,景观优势度较高,且斑块的破碎度较低。
3.3 景观生态风险时空变化分析
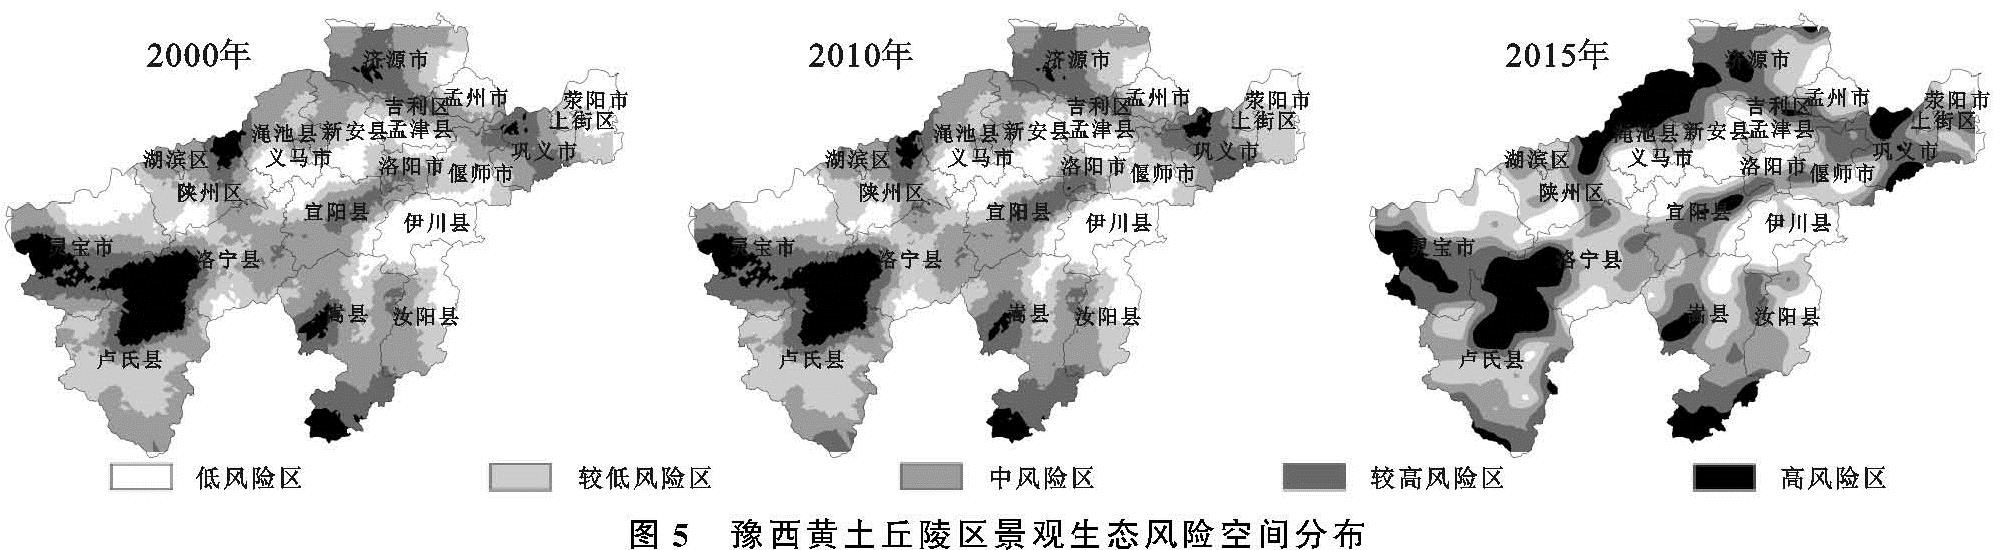
为了进一步分析豫西黄土丘陵区景观生态风险的空间分异特征,本研究借助地统计学方法,将研究区1 096个采样单元的生态风险值(ER)进行克里金插值(Kriging),得到豫西黄土丘陵区景观生态风险的空间分布图(图5)。利用ArcGIS自然断点法(Natural Breaks)将研究区的景观生态风险划分为高风险、较高风险、中风险、较低风险以及低风险区5个等级,赋值区间分别为:较高风险区(ER>0.45)、较高风险区(0.40<ER≤0.45)、中风险区(0.36<ER≤0.40)、较低风险区(0.32<ER≤0.36)、低风险区(ER≤0.32)。2000—2015年豫西黄土丘陵区景观生态风险整体呈现上升趋势,其中较低、中生态风险区所占比重较大,高风险生态风险所占面积较小。
2000年豫西黄土丘陵区低、较低生态风险分布区域分别占研究区总面积的18.22%,23.77%。低生态风险区主要集中分布在孟津县西部、新安县南部、宜阳县北部、渑池县南部以及伊川县等区域,灵宝北部、孟州西部也有分布,该区域位于黄土台地丘陵和伊川临汝盆地,较低生态风险区主要分布在低生态风险区周边区域,土地利用类型主要以耕地为主,土地利用类型单一且集中连片。这些区域景观类型以耕地为主,林地和草地等景观在周边分布,耕地、林地的景观脆弱度较低,且耕地景观集中连片分布,因此这些区域生态风险等级较低。中生态风险区主要分布在渑池县和新安县北部、洛宁县东部、宜阳县南部及嵩县中北部等区域,处于耕地和林地景观类型的过渡带,占研究区总面积的34.98%。较高风险区主要分布在济源市西部、洛阳—宜阳一线以及巩义市中部区域,占研究区总面积的14.99%。高生态风险区主要分布在卢氏县—洛宁县—灵宝县三角地带,这一区域属于黄土覆盖低山区,占研究区总面积的8.04%,景观类型主要为林地、坡旱地,且景观较为破碎,人类活动强度的增加极易引起水土流失、林草退化等生态环境问题。
2010年豫西黄土丘陵区生态风险各等级面积发生相应变化,但空间分布规律较2000年未发生明显变化。其中生态风险低、较低等级所占面积较2000年增加了2.96%,面积增加区域主要是生态风险区低、较低等级向外扩展,面积增大。生态风险中等级分布面积有大幅度的减少,面积占比较2000年减少了6.32%,生态风险中等级区域主要转变为较高生态风险区等级,减少的区域主要分布在洛阳—宜阳一线、济源市、巩义和荥阳市,这些区域人类活动强度增大,大面积耕地景观向建设用地类型转换,使得原有较完整的景观变得破碎,景观生态风险在逐渐增大。较高生态风险等级区域面积占比较2000年增加了3.85%,主要是集中分布在济源西部、灵宝市南部、洛阳—宜阳一线以及巩义市,这些区域林地转换为耕地和草地景观,景观类型转换的区域生态脆弱度增大,高生态风险区面积略有减少,面积占比较2000年减少了0.47%。2015年豫西黄土丘陵区中生态风险和高生态风险区面积及空间分布发生了显著变化,低生态风险区较2010年基本保持稳定,生态风险较低、中等级分布面积较2010年显著减少,分别减少了3.36%,5.69%; 生态风险较高等级面积占比较2000年增加了1.93%,高生态风险区等级所占面积增长较为显著,较2010年增加了6.88%。较高、高生态风险变化的区域主要集中在渑池县北部、巩义市、荥阳市西部,这些区域的基质景观类型以耕地为主,受到人类活动干扰后的损失度较高,另外,这些区域耕地景观向建设用地转换,景观的破碎度及分离度也在不断增大。
2000—2015年,豫西黄土丘陵区低、较低生态风险区面积基本保持稳定,仅减少了0.17%,中生态风险区所占面积减小幅度较大,面积占比较2000年减少了12.02%,2015年较高、高生态风险区所占面积较2000年增加了12.19%,呈现明显的上升趋势。在这15 a间,研究区景观生态风险整体呈现上升趋势,高生态风险区的基质景观类型以耕地为主,受到人类活动干扰后的损失度较高,随着人类活动强度增强,土地利用类型的转化强度也在不断加大,景观类型转换的区域生态脆弱度增大(林地转换为耕地和草地),景观的破碎度及分离度也在不断增大(耕地转换为建设用地)。
图6 2000-2015年研究区景观生态风险各等级面积占比