2.1 极端气温指数时间变化特征
2.1.1 极值指数时间变化
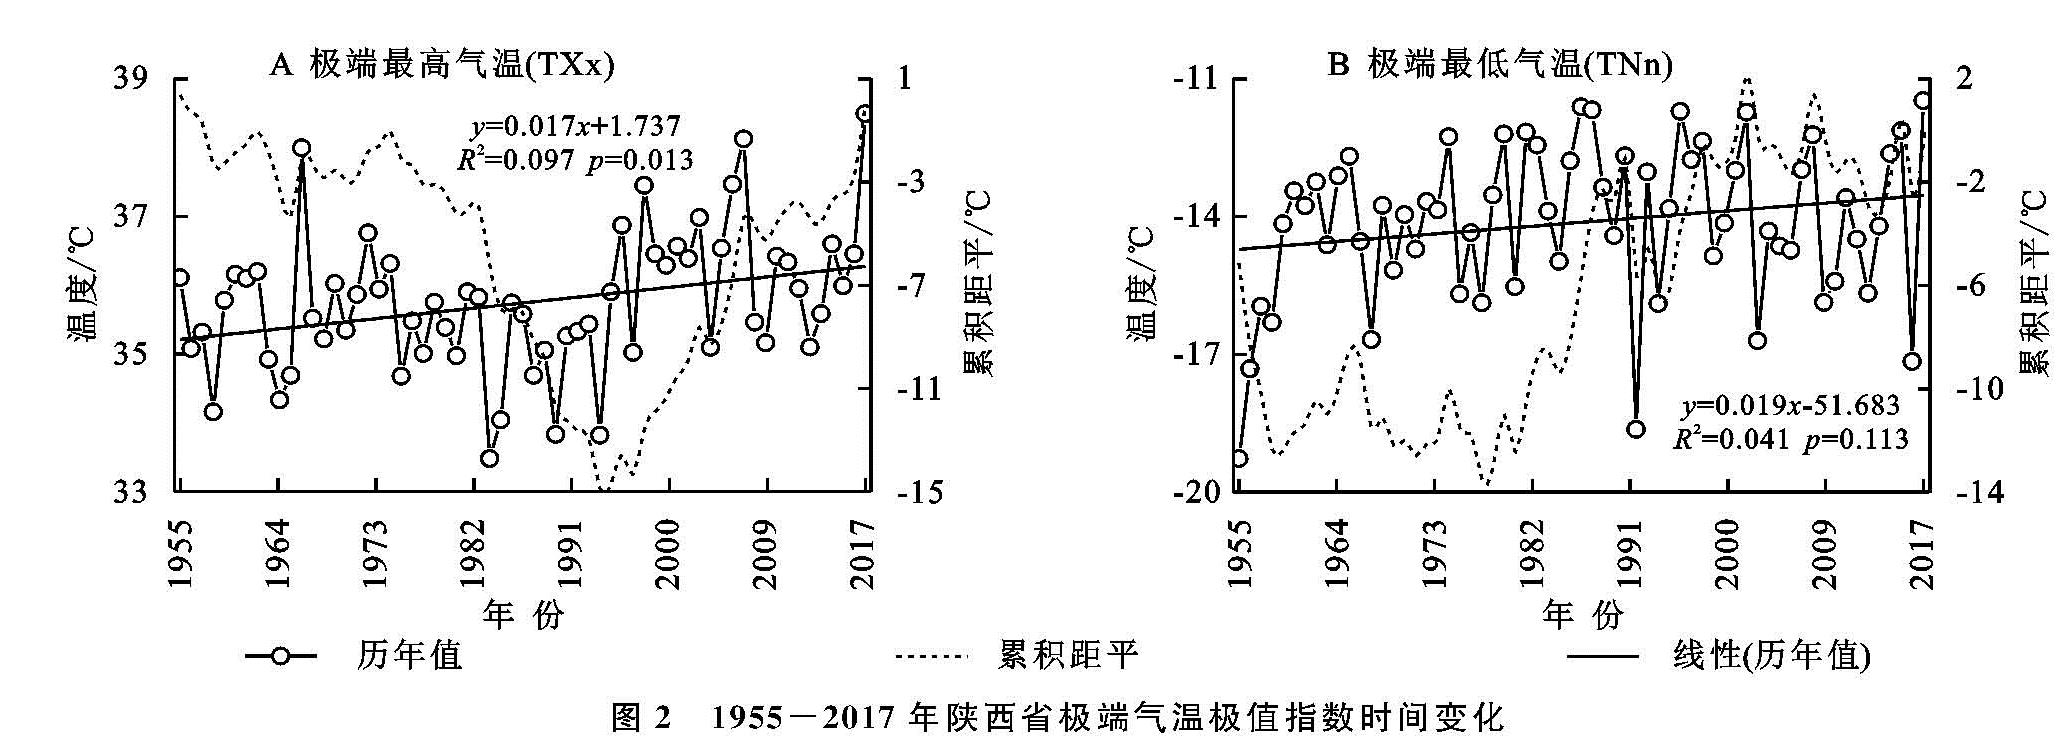
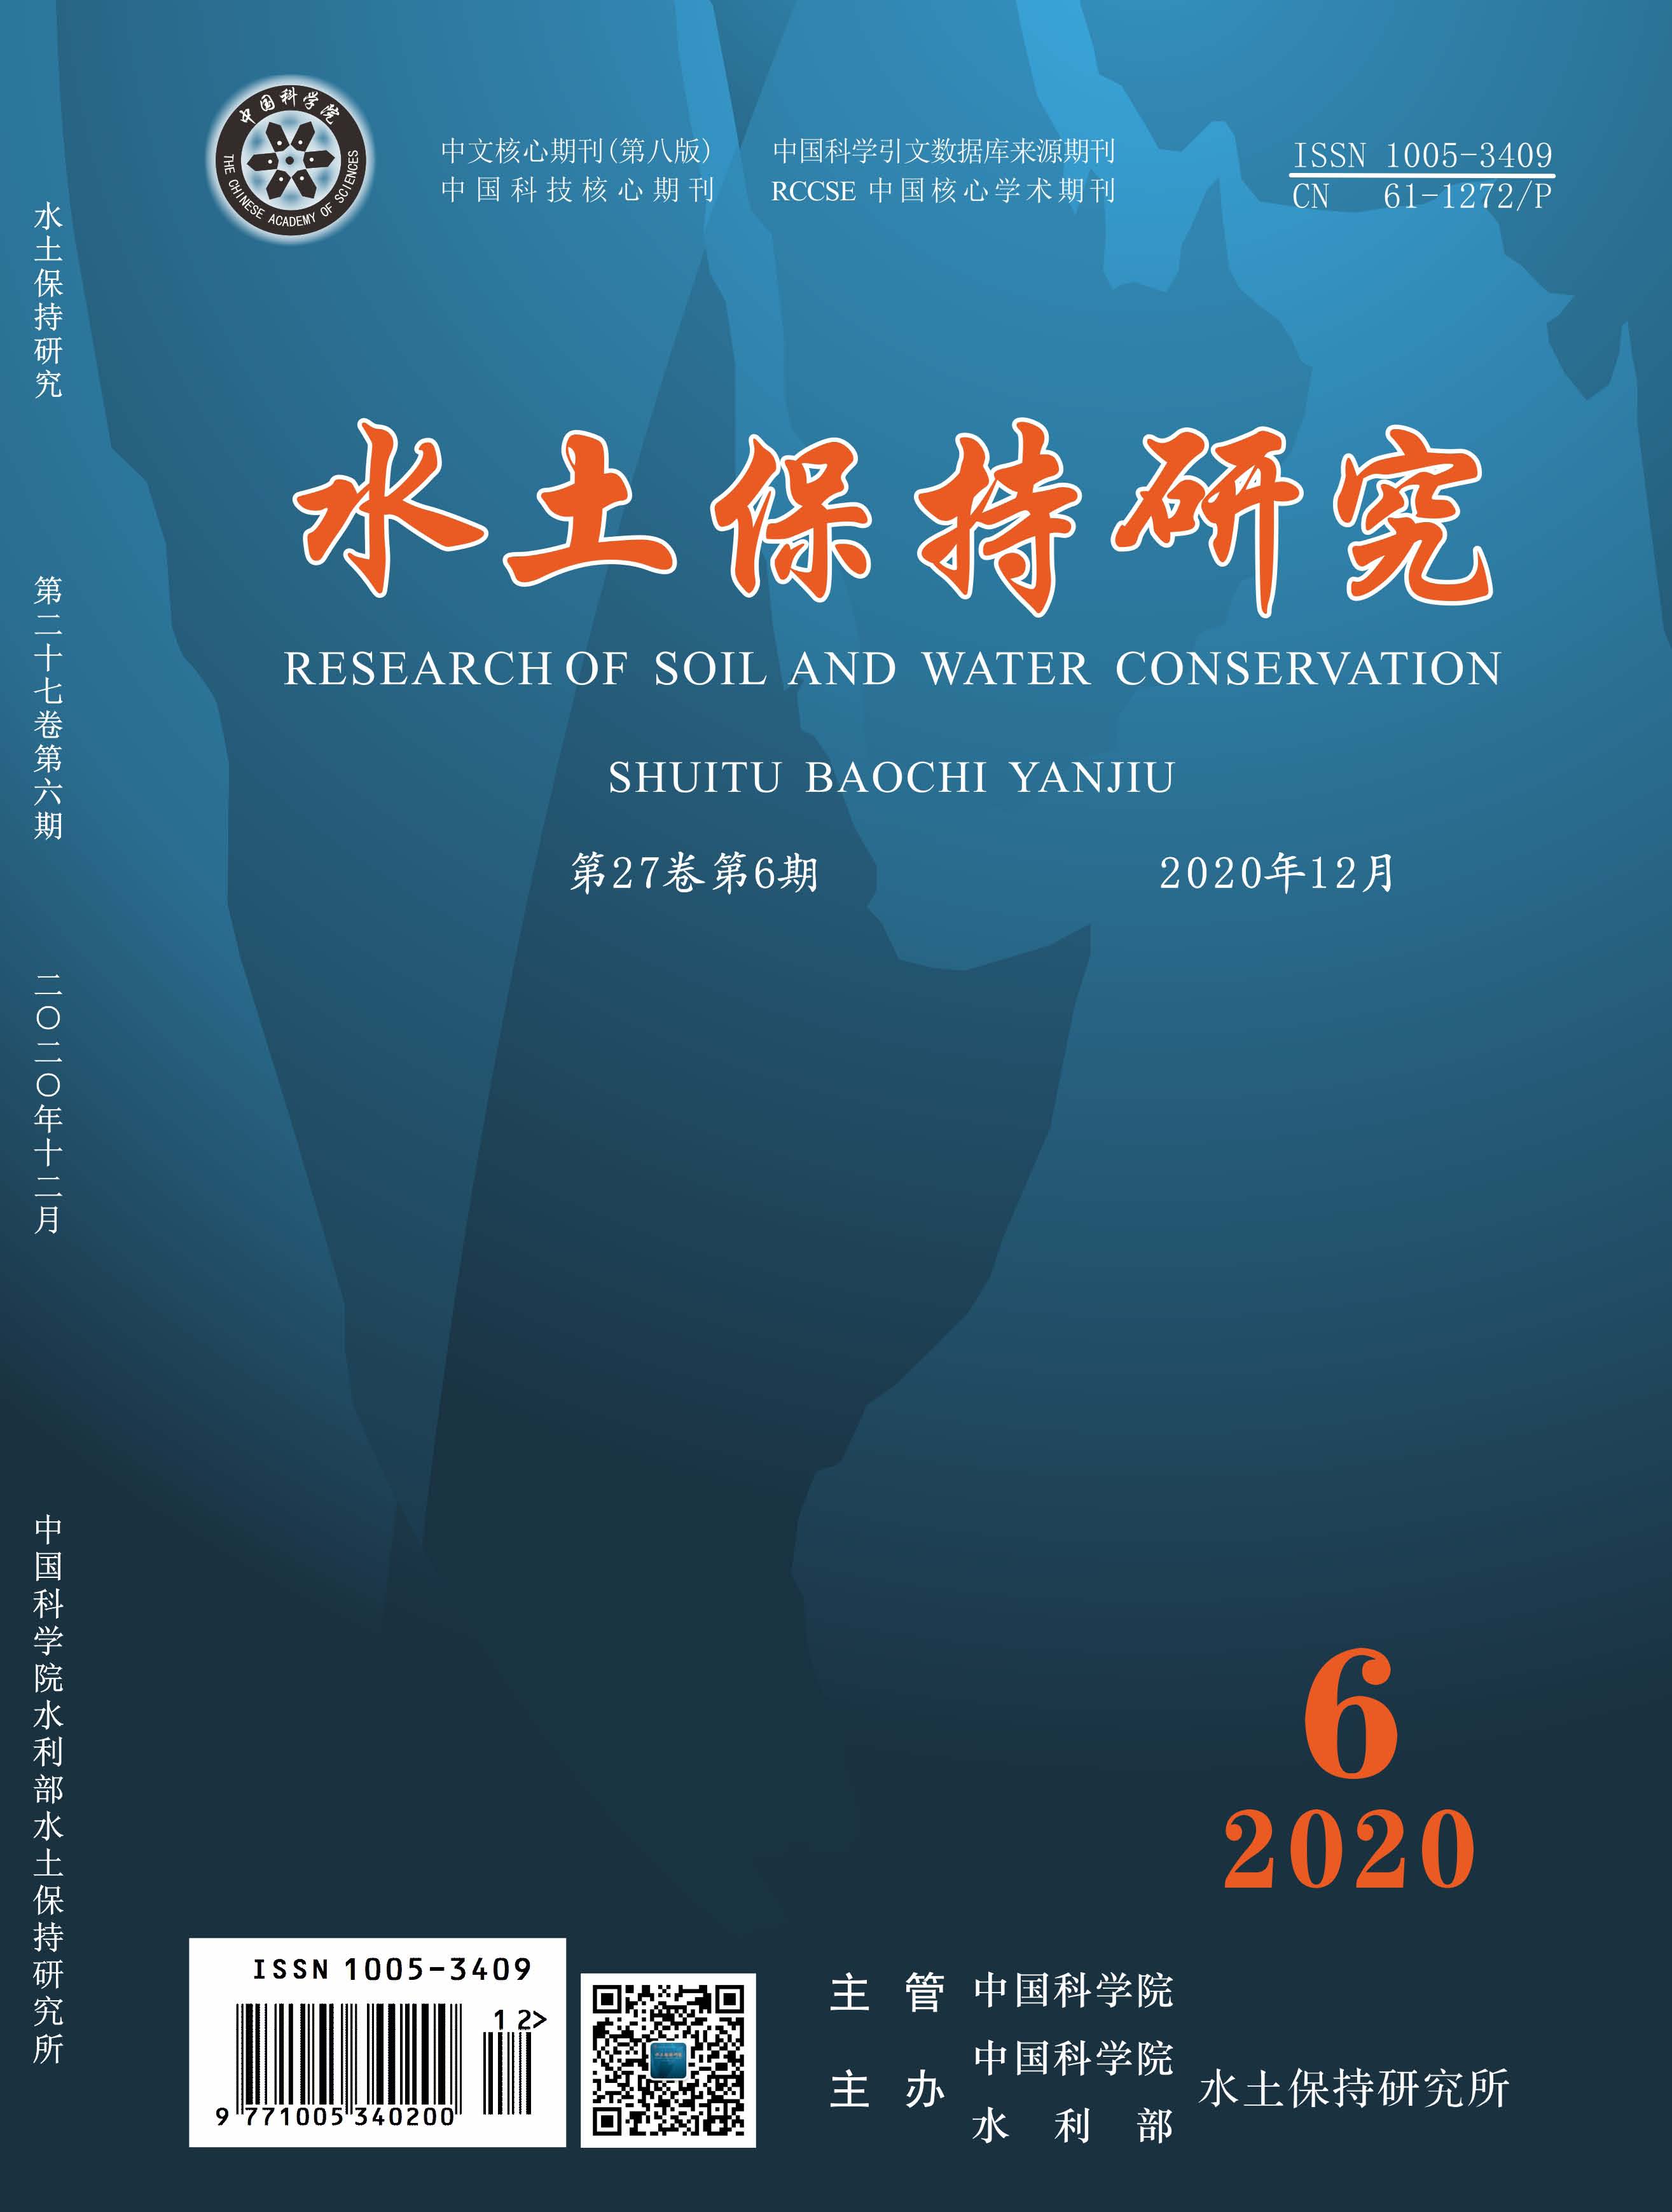
由图2可知,1955—2017年期间,陕西省极端最高气温(TXx)和极端最低气温(TNn)均呈上升趋势,其气候倾向率分别为0.17,0.19℃/10 a; 其中极端最高气温的上升趋势通过0.05显著性检验,表明极端最高气温升温显著,而极端最低气温的上升趋势不显著。极端最高气温最小值出现在1983年(33.48℃),最大值出现在2017年(38.50℃); 极端最低气温最小值出现在1955年(-19.27℃),最大值出现在2017年(-11.48℃),可以看出,近63 a陕西省气温总体呈增暖趋势,与尹红等[22]认为2017年中国TXx和TNn处于1961年以来的第2位观点几乎一致。从累积距平看,TXx在1993年之前为下降趋势,之后转为上升趋势,呈V型曲线变化; TNn在1977年之前为下降趋势,之后转为上升趋势,且1977—2000年上升幅度大。
2.1.2 绝对指数时间变化
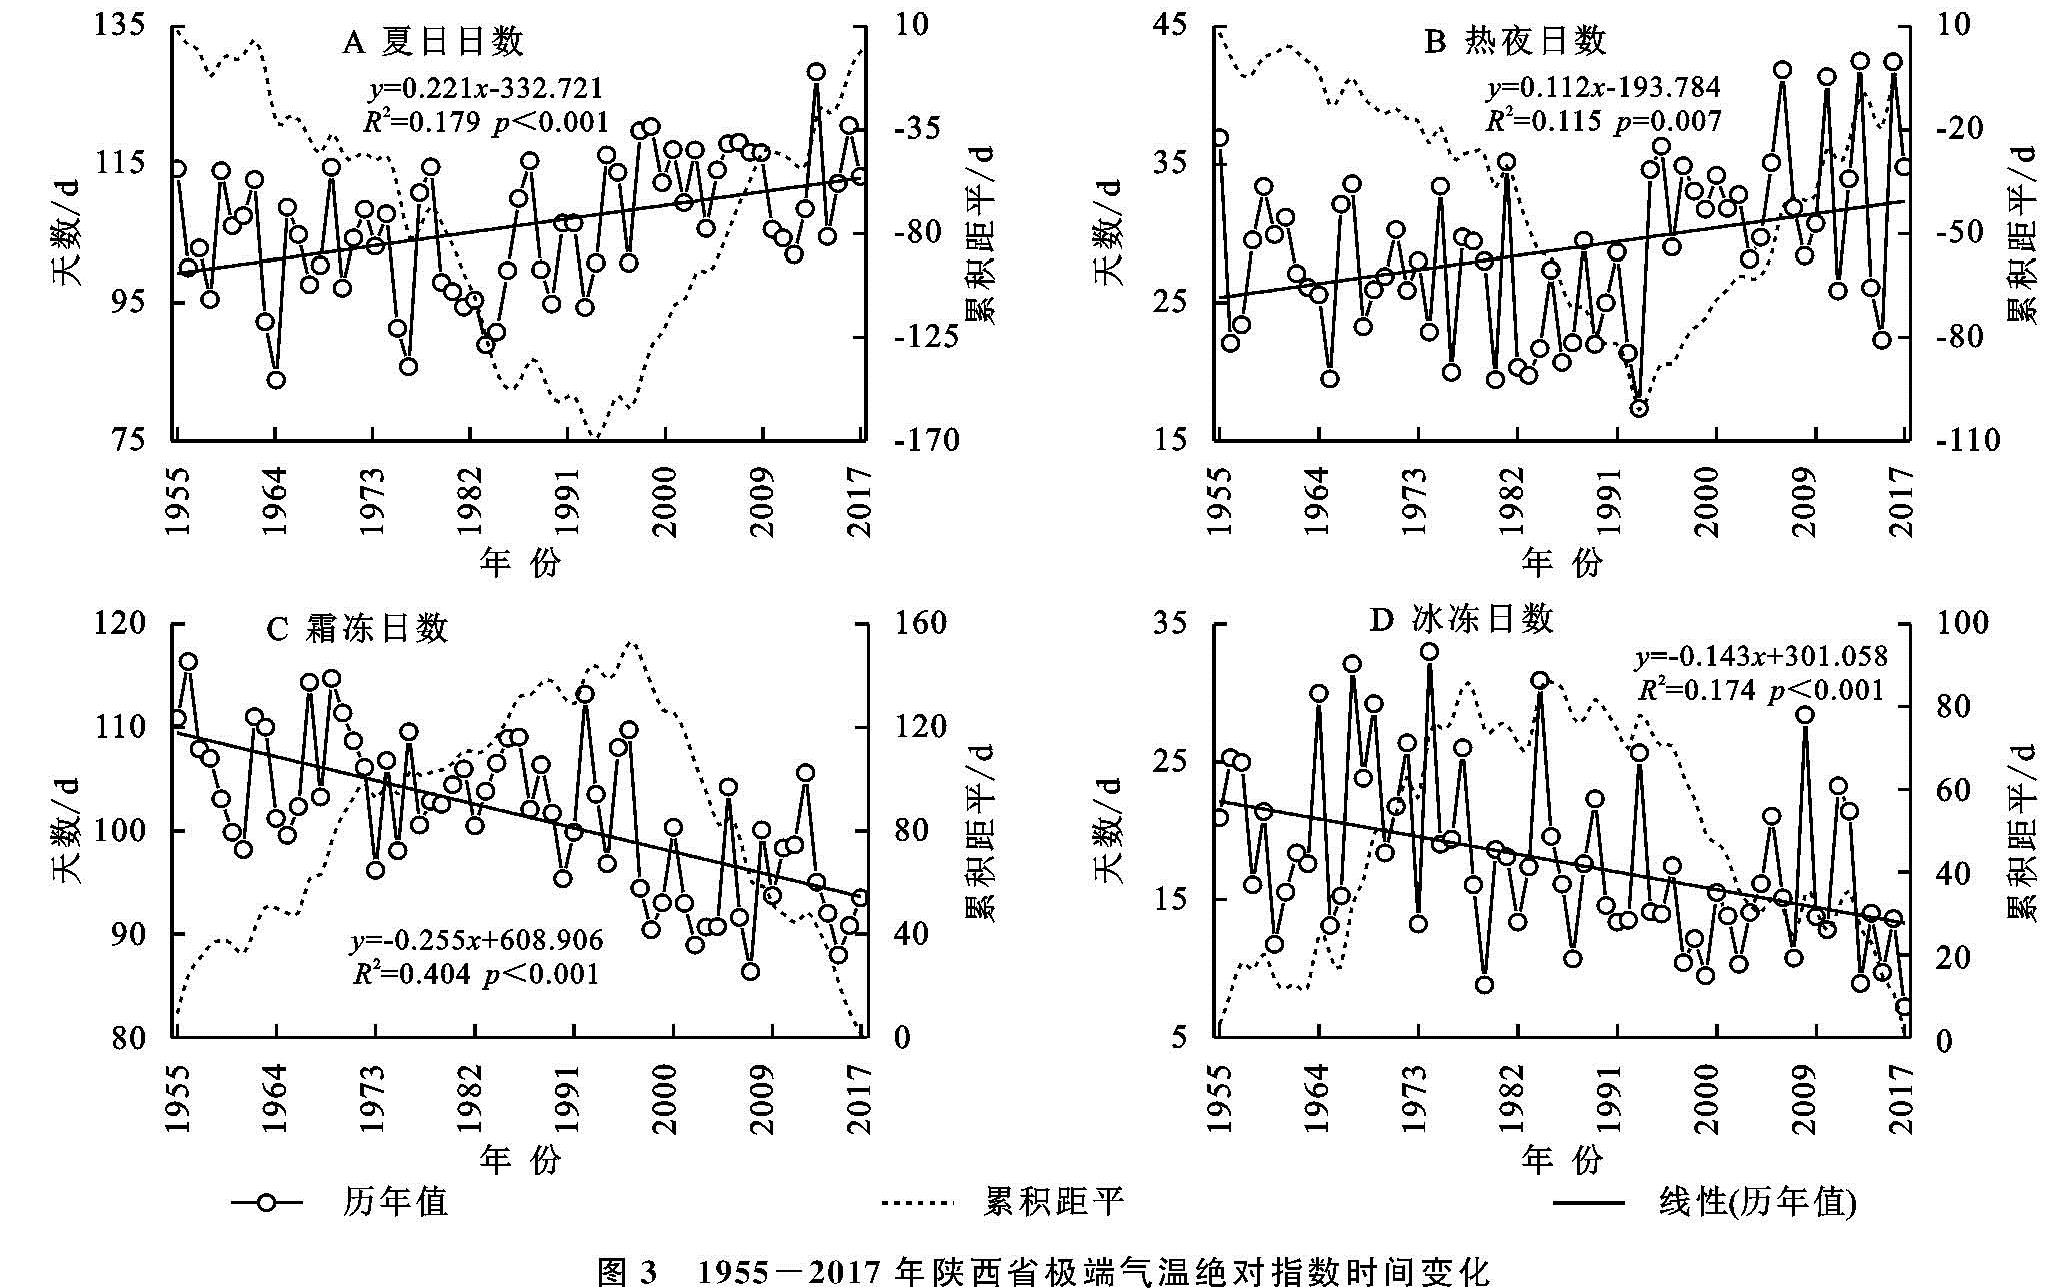
从时间看,1955—2017年陕西省极端气温绝对指数均表现显著变化趋势(p<0.01),夏日日数(SU25)呈显著上升趋势,其速率为2.21 d/10 a(图3),与中国大陆1956—2008年(2.10 d/10 a)增加速率相当[9]; 热夜日数(TR20)以1.12 d/10 a速率呈显著上升趋势,低于中国(2.00 d/10 a)增加速率[9]。霜冻(FD0)、冰冻日数(ID0)均表现出极明显的下降趋势,其速率分别为-2.55,-1.43 d/10 a,均低于中国霜冻日数(-3.00 d/10 a)和冰冻日数(-1.80 d/10 a)下降速率[9]。可见近63 a陕西省SU25上升趋势快于TR20,FD0下降趋势快于ID0。从累积距平看,ID0呈双峰型曲线,SU25和TR20呈V型曲线,FD0则呈倒V曲线变化。SU25,TR20均在1993年之前为下降趋势,之后转为上升趋势,与TXx变化年份一致; FD0在1996年之前为上升趋势,之后变为下降趋势; ID0在80年代中后期以前为上升趋势,之后变为下降趋势。
2.1.3 相对指数时间变化
由图4可以看出,1955—2017年陕西省极端气温相对指数与绝对指数的变化特征相似,具体看,暖昼日数(TX90)和暖夜日数(TN90)的上升速率分别为1.58,2.05 d/10 a,均高于全球暖昼(0.80 d/10 a)和暖夜日数(1.17 d/10 a)上升速率[8]; 冷昼日数(TX10)和冷夜日数(TN10)的下降速率分别为1.34,1.85 d/10 a,高于全球冷昼(0.67 d/10 a)和冷夜日数(1.09 d/10 a)的下降幅度[8]。进一步分析发现,近63 a陕西省夜指数(TN90,TN10)增加速率高于昼指数(TX90,TX10)。从累积距平看,极端气温相对指数的累积距平曲线均呈抛物线型变化,且均在1993年发生转折,TX10和TN10在1993年前为上升,而后转为下降; TX90和TN90情况与之相反(图4)。
综上所述,1955—2017年陕西省极端气温暖指数(TXx,SU25,TR20,TX90和TN90)均呈显著上升趋势(p<0.05),除了TNn呈不显著的上升趋势,其余极端气温冷指数(FD0,ID0,TX10和TN10)均呈极显著下降趋势(p<0.001),这些指数的变化趋势都指示出近63 a来陕西省气温呈上升趋势,验证了董思等[23]对陕西省气温呈增加趋势(1955—2013年)的结论,也表明了陕西省变暖趋势响应了全球气候变暖大背景。
图2 1955-2017年陕西省极端气温极值指数时间变化
图3 1955-2017年陕西省极端气温绝对指数时间变化
2.2 极端气温指数的突变特征
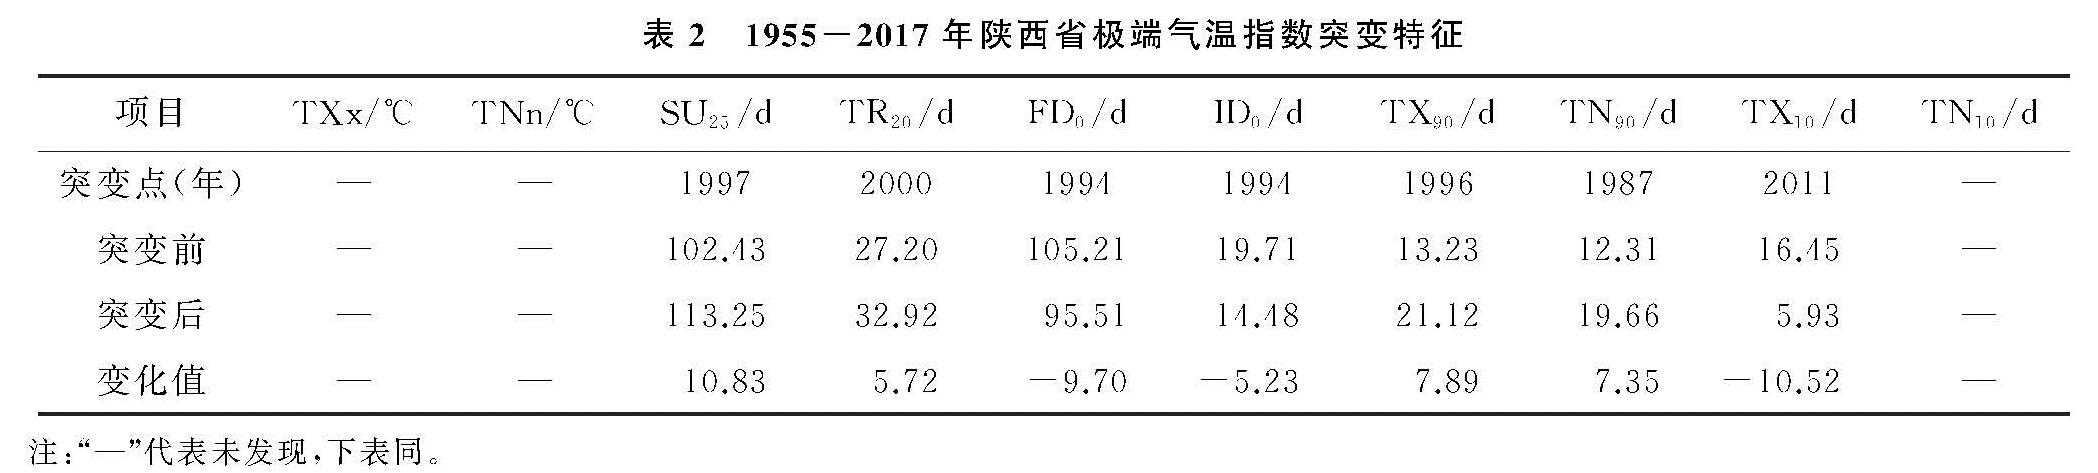
为进一步研究1955—2017年陕西省极端气温的时间变化特征,综合运用M-K和累积距平曲线对10项极端气温指数进行突变分析,结果见表2。近63 a年陕西省多数极端气温指数发生了突变,突变年份集中在20世纪90年代中后期—21世纪初。其中,SU25,TR20,TX90和TN90等暖指数经历了由少到多的上升突变,FD0,ID0和TX10等冷指数经历了由多到少的下降突变,而TXx,TNn和TN10未发生突变。具体来看,SU25在1997年发生突变,突变后较突变前增加10.83 d; TR20在2000年发生突变,突变后较突变前增加5.72 d; FD0和ID0均在1994年发生突变,分别由突变前的105.21,19.71 d降为突变后的95.51,14.48 d; 暖昼日数突变点为1996年,突变后较突变前分别增加了7.89 d; 暖夜日数在1987年突变,由突变前的12.31 d上升至突变后的19.66 d; 冷昼日数在2011年发生突变,突变后较突变前分别减少10.52 d。
2.3 极端气温指数的空间变化特征
2.3.1 极值指数的空间变化
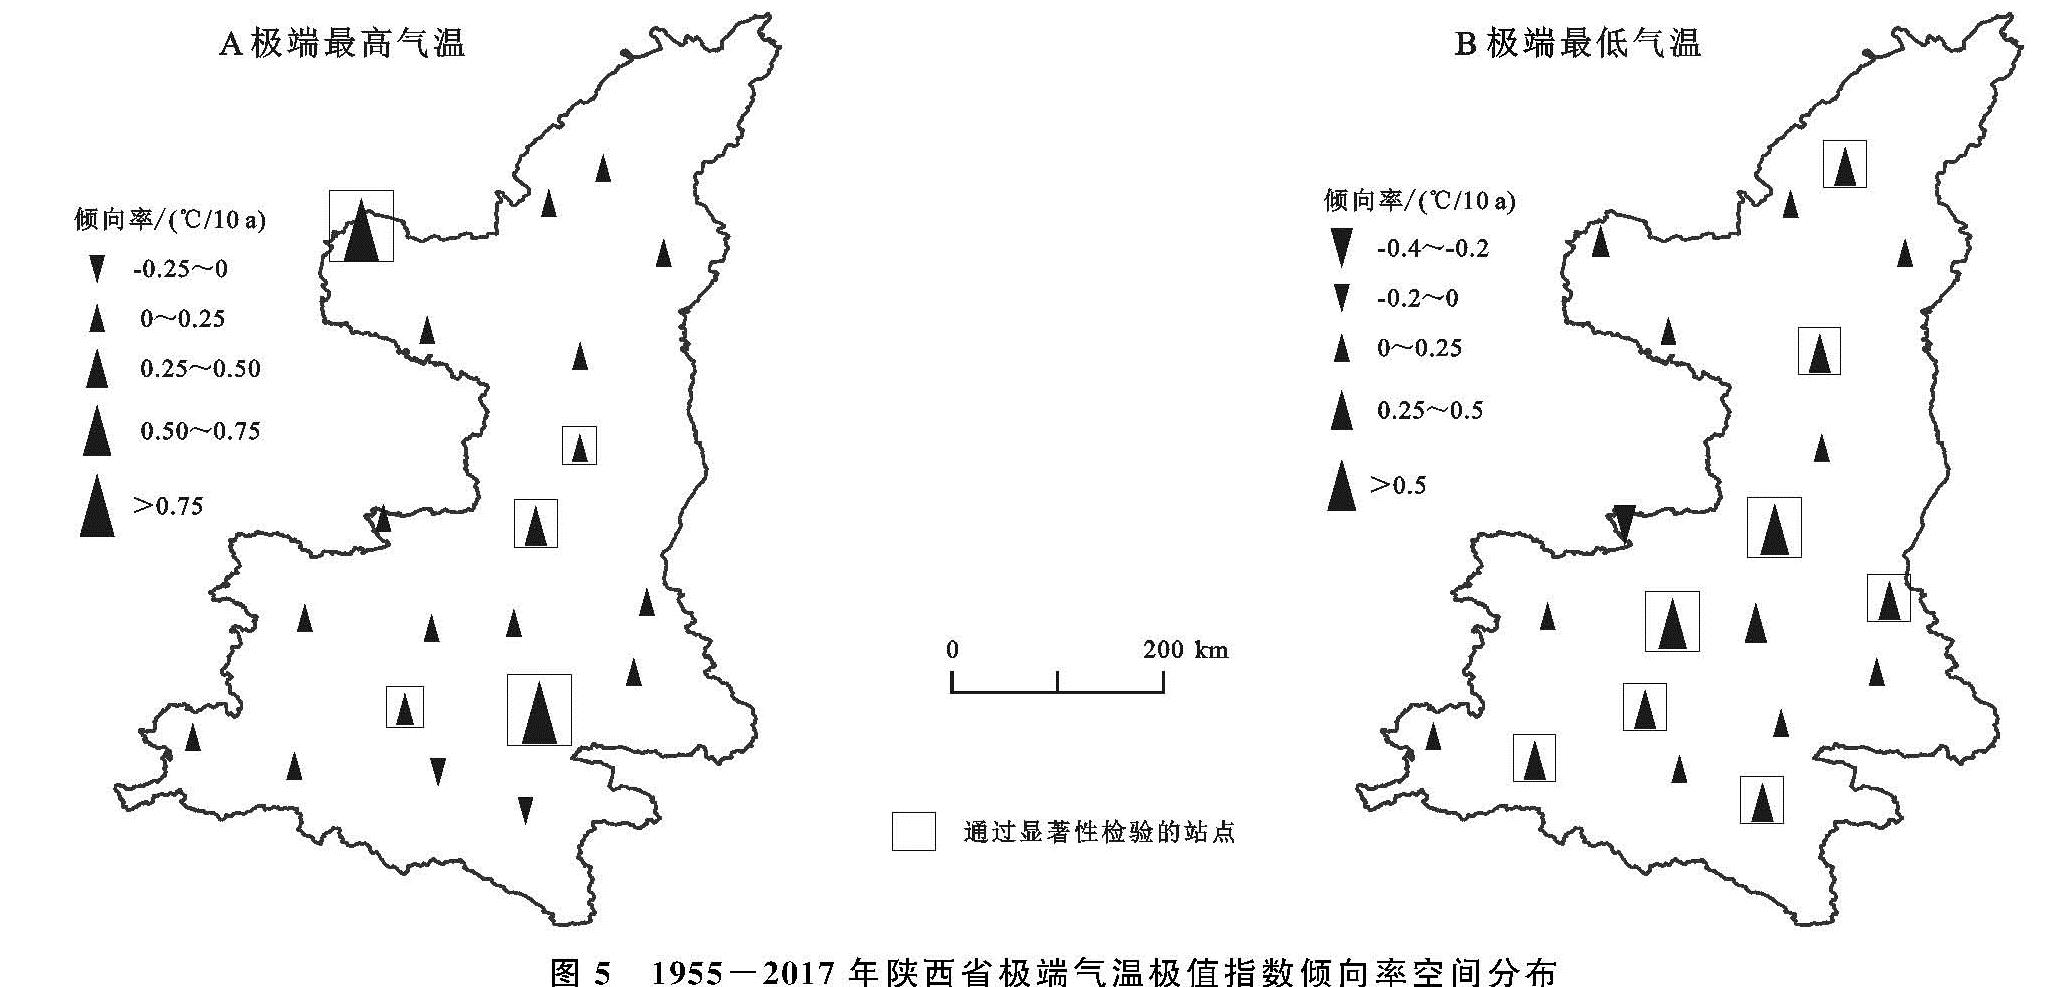
由图5可知,1955—2017年陕西省极端最高气温(TXx)、极端最低气温(TNn)整体表现为上升趋势,其倾向率变化分别介于-0.07~0.89℃/10 a,-0.22~0.63℃/10 a,分别有25%,40%站点通过显著性水平(p<0.05)检验。TXx上升趋势最显著的为定边站,TNn增加趋势最显著的为铜川站。作为区域高温重要指标TXx,陕西省共有18个站点的TXx呈上升趋势,这使得该区域高温热浪风险增大。
图4 1955-2017年陕西省极端气温相对指数时间变化
表2 1955-2017年陕西省极端气温指数突变特征
图5 1955-2017年陕西省极端气温极值指数倾向率空间分布
2.3.2 绝对指数空间变化
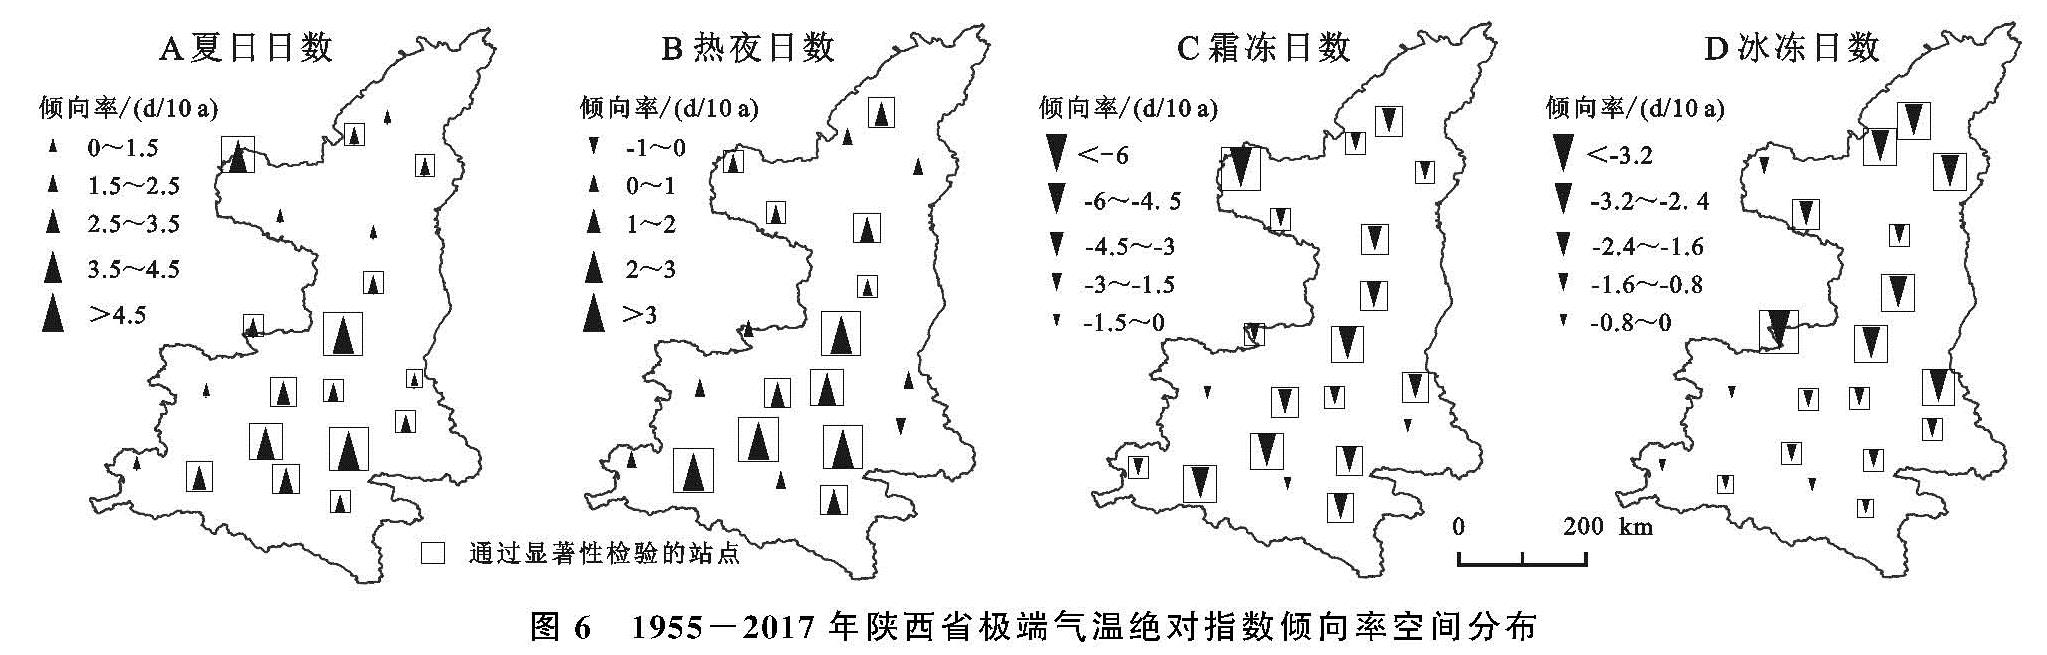
近63 a陕西省绝对指数趋势变化空间分布如图6所示,所有站点的夏日日数(SU25)和95%站点的热夜日数(TR20)呈上升趋势,其倾向率变化分别为0.25~9.14,-0.80~3.88 d/10 a,其中通过显著性水平(p<0.05)检验的站点比例分别为75%,60%。SU25以镇安站上升趋势最为显著,TR20以佛坪站上升趋势最为显著。所有站点的霜冻日数(FD0)和冰冻日数(ID0)均呈一致下降趋势,其倾向率变化分别为-6.55~-1.22 d/10 a,-3.27~0.08 d/10 a,85%站点的FD0,80%站点的ID0通过显著性水平(p<0.05)检验。FD0和ID0分别以定边站和长武站下降趋势最为显著。此外,SU25上升幅度高于TR20的气象站占全部站点的75%,FD0下降幅度高于ID0的占全部站点的85%,验证了陕西省气温变化的昼夜不对称性。
图6 1955-2017年陕西省极端气温绝对指数倾向率空间分布
2.3.3 相对指数空间变化
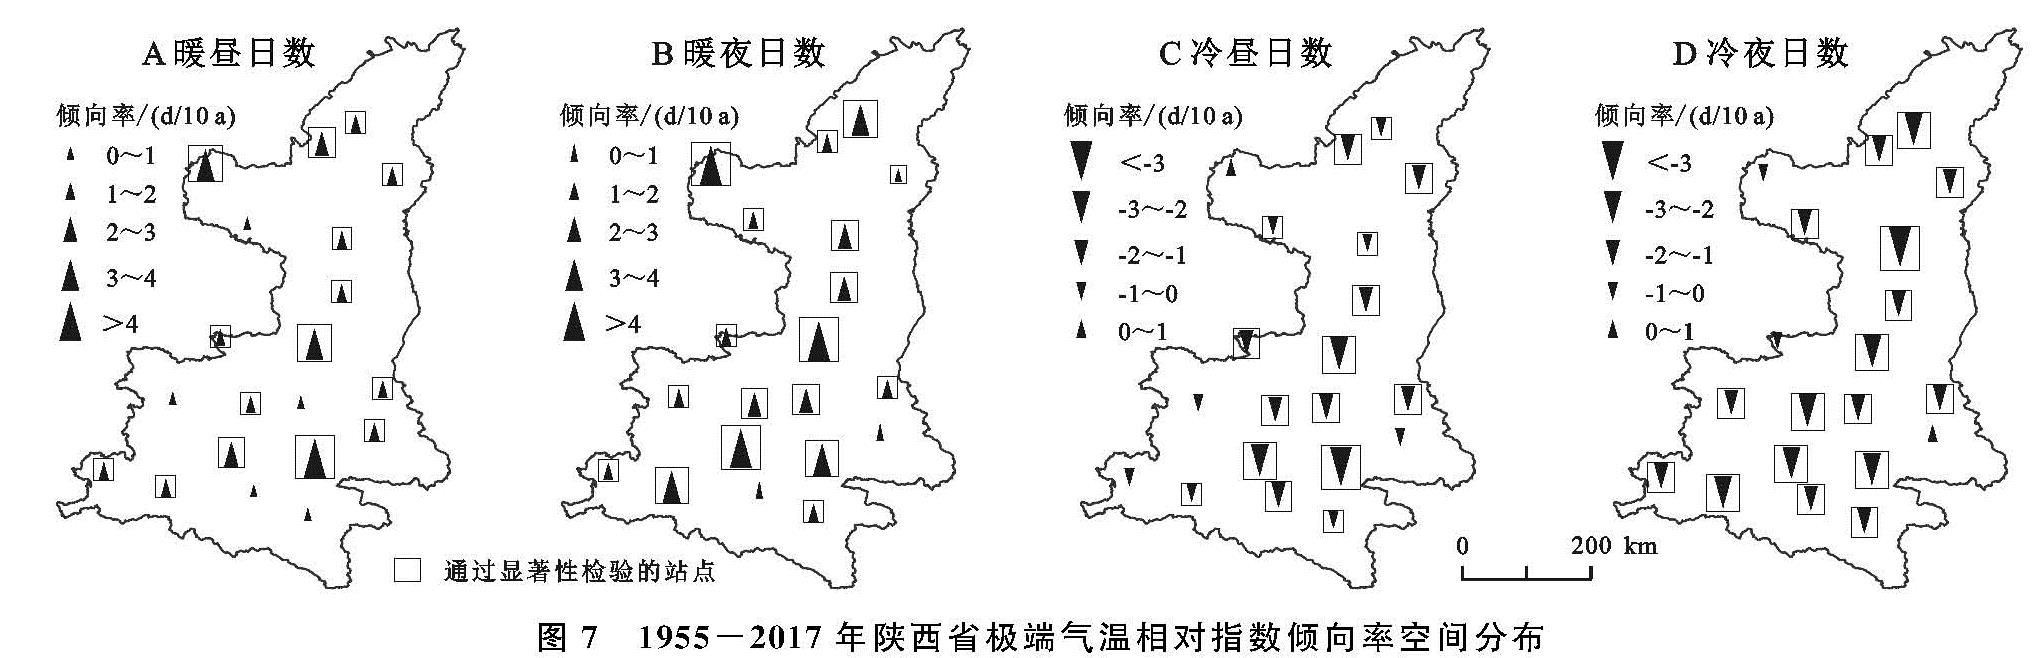
由图7可知,近63 a陕西省暖昼日数(TX90)和暖夜日数(TN90)均表现为一致的增加趋势,其倾向率变化分别为0.32~5.53,0.25~5.19 d/10 a,其中75%气象站点的TX90,90%站点的TN90增加趋势显著(p<0.05)。TX90上升幅度最大的出现在镇安站,TN90上升幅度最大的出现在铜川站。95%气象站点的冷昼日数(TX10)和冷热日数(TN10)表现为减少趋势,其倾向率变化分别为-4.43~0.07,-3.31~0.08 d/10 a,其中80%气象站点的TX10,85%站点的TN10减少趋势显著(p<0.05)。TX10和TN10下降幅度最大的分别出现在镇安站和延安站。进一步统计发现,TX90倾向率变化低于TN90的站点占全部站点的65%,TX10倾向率变化低于TN10的站点占全部站点的20%,表明近63 a陕西省暖夜日数上升趋势快于暖昼,冷昼日数下降趋势快于冷夜,存在昼夜指数变化的不对称性。
图7 1955-2017年陕西省极端气温相对指数倾向率空间分布
2.4 极端气温指数的主成分分析
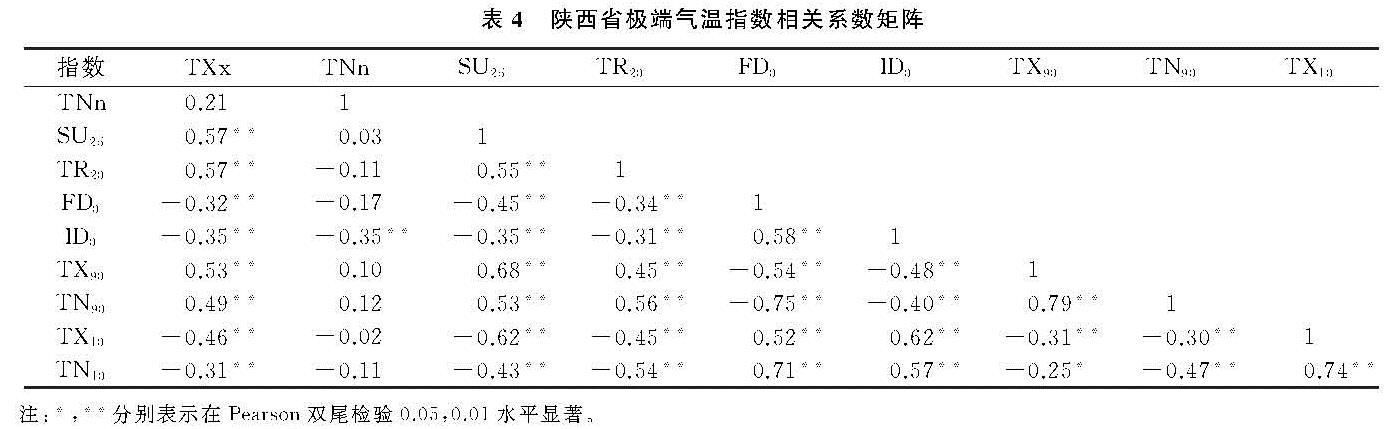
运用主成分分析得到1957—2017年陕西省极端气温指数的主成分,KMO指数为0.63,Bartlett球形检验显著,3个主成分特征值均大于1,分别占方差贡献率的50.15%,13.01%,11.59%,累积方差贡献率达到74.75%,符合分析要求(表3)。第1主成分在TXx,SU25,TR20,TX90和TN90的载荷均高于0.64,主要反映了极端气温暖指数变化特征,与全球气候变暖背景吻合。相关性分析(表4)表明,各项极端气温暖指数之间均呈正相关,且相关性显著(p<0.01),与FD0,ID0,TN90和TX10均呈显著负相关(p<0.05)。第2主成分在FD0,ID0,TN90和TX10的载荷较高,均在0.62以上,主要反映了极端气温冷指数变化特征,且这4项指数间均呈显著正相关(p<0.01)。TNn在第3主成分中的载荷高达0.89,反映了极端最低气温变化特征,与ID0的相关系数为-0.35,且通过0.01显著检验。进一步由表4可知,除与TNn相关性不显著外,TXx与SU25等指数均呈显著相关,而TNn仅与ID0呈显著负相关,表明近63 a陕西省气温的增加主要受到最高气温变化的影响,日最高温的升高对各指数变化的影响程度更为明显。
3 讨论与结论
3.1 讨 论
1955—2017年期间,陕西省极端气温的极值指数及表征暖指数均呈上升趋势,冷指数均呈下降趋势,说明陕西省气温变化响应了全球气候变暖背景。其研究结果与陕西省各地区研究基本一致[17-20],但各指数变化倾向率略有差异。以冷昼和冷夜指数为例,本研究分别以-1.34 d/10 a和-1.85 d/10 a的速率下降(1955—2017年),均低于张宁[16]的研究结果-2.82 d/10 a和-4.05 d/10 a(1961—2010年),其原因与研究时段不同有关。研究时段内,陕西省白昼增温幅度低于夜间增温幅度,存在气温变化的昼夜不对称性现象,表明该地区各极端气温指数的变化受日最高温影响更为明显。在极端气温指数突变方面,陕西省多数极端气温指数突变集中在20世纪90年代中后期—21世纪初,与贵州省突变的时期一致[11],早于内蒙古自治区突变时期[12]。以上陕西省极端气温变化特征与其境内跨中温带、暖温带及北亚热带季风气候,南北气候差异大有关。此外,本文所采用陕西省20个气象站点的逐日最高和最低温数据均已经过严格质量检验,但存在站点少,且未考虑气象站迁址、土地覆被变化等因素所带来的气温影响,进而影响到极端气温指数的变化特征。因此,未来的研究应该还需收集更多气温数据,同时注重气温均一化等处理方法,才能更全面了解陕西省极端气温事件的时空变化特征。
3.2 结 论
(1)1955—2017年陕西省极端气温指数中,TXx,TNn,SU25,TR20,TX90和TN90分别以0.17℃/10 a,0.19℃/10 a,2.21 d/10 a,1.12 d/10 a,1.58 d/10 a,2.05 d/10 a倾向率上升,FD0,ID0,TX10和TN10分别以-2.55 d/10 a,-1.43 d/10 a,-1.34 d/10 a,-1.85 d/10 a倾向率下降。
(2)陕西省多数极端气温指数在20世纪90年代中后期—21世纪初发生了突变,SU25,TR20,TX90和TN90经历了由少到多的上升突变,FD0,ID0和TX10经历了由多到少的下降突变。
(3)空间尺度上,多数站点TXx,TNn,TR20和所有站点SU25,TX90,TN90,的倾向率呈上升趋势,多数站点TX10,TN10和所有站点FD0,ID0的倾向率呈下降趋势; 镇安、定边和铜川站的各指数倾向率变幅最为明显。
(4)1955—2017年陕西省存在气温变化的昼夜不对称性,极端气温事件主要受日最高、最低温升高的影响,而日最高温的上升对各指数影响更为明显。