3.5.1 植被覆盖度时空格局变化
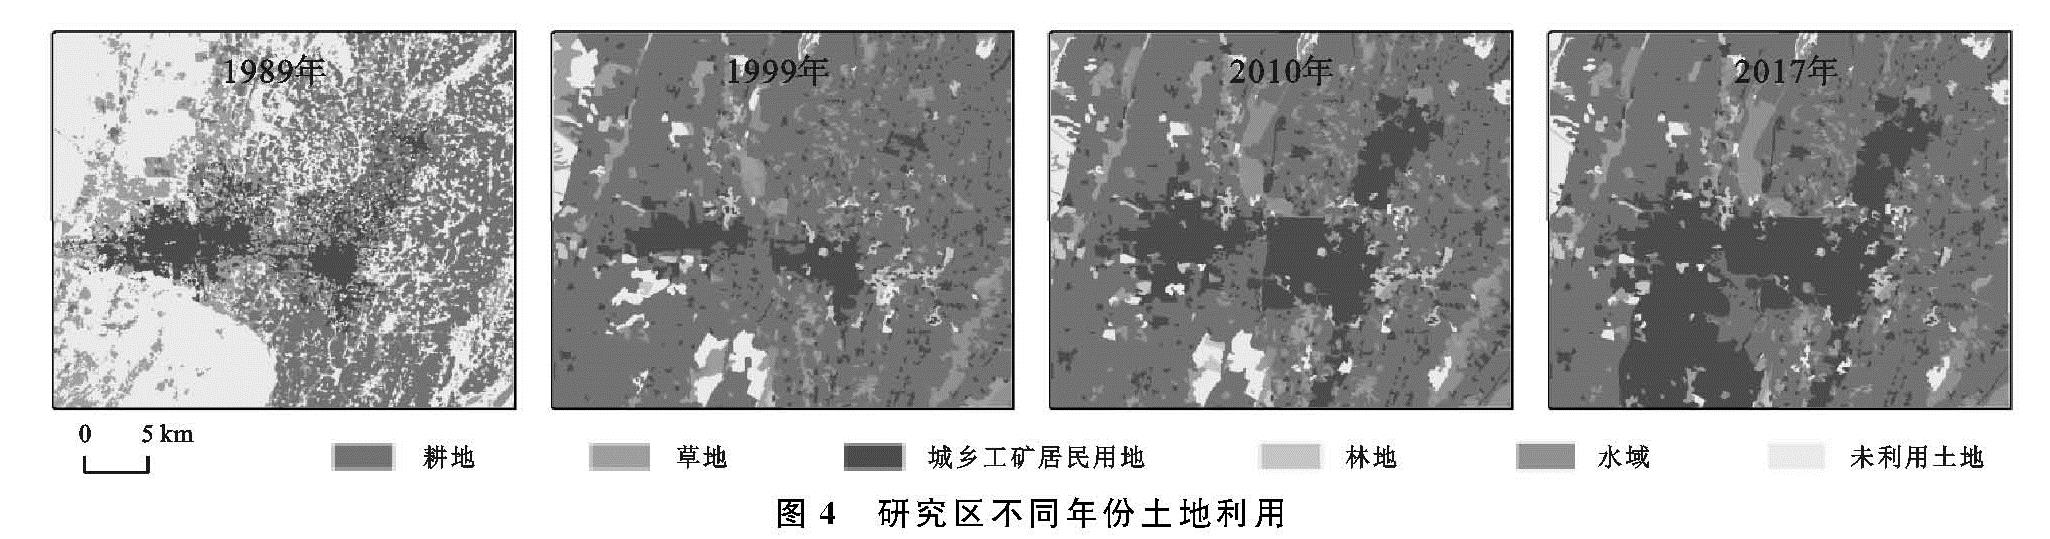
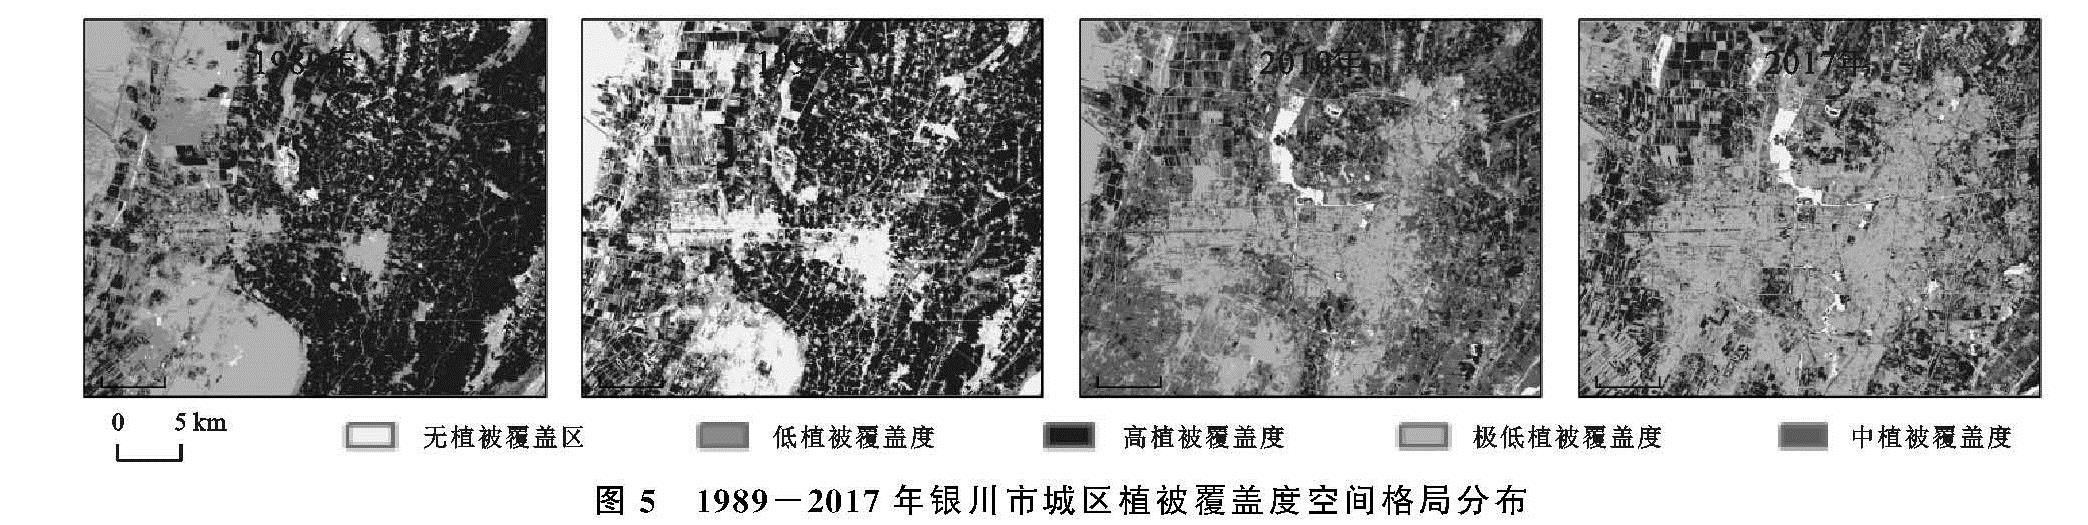
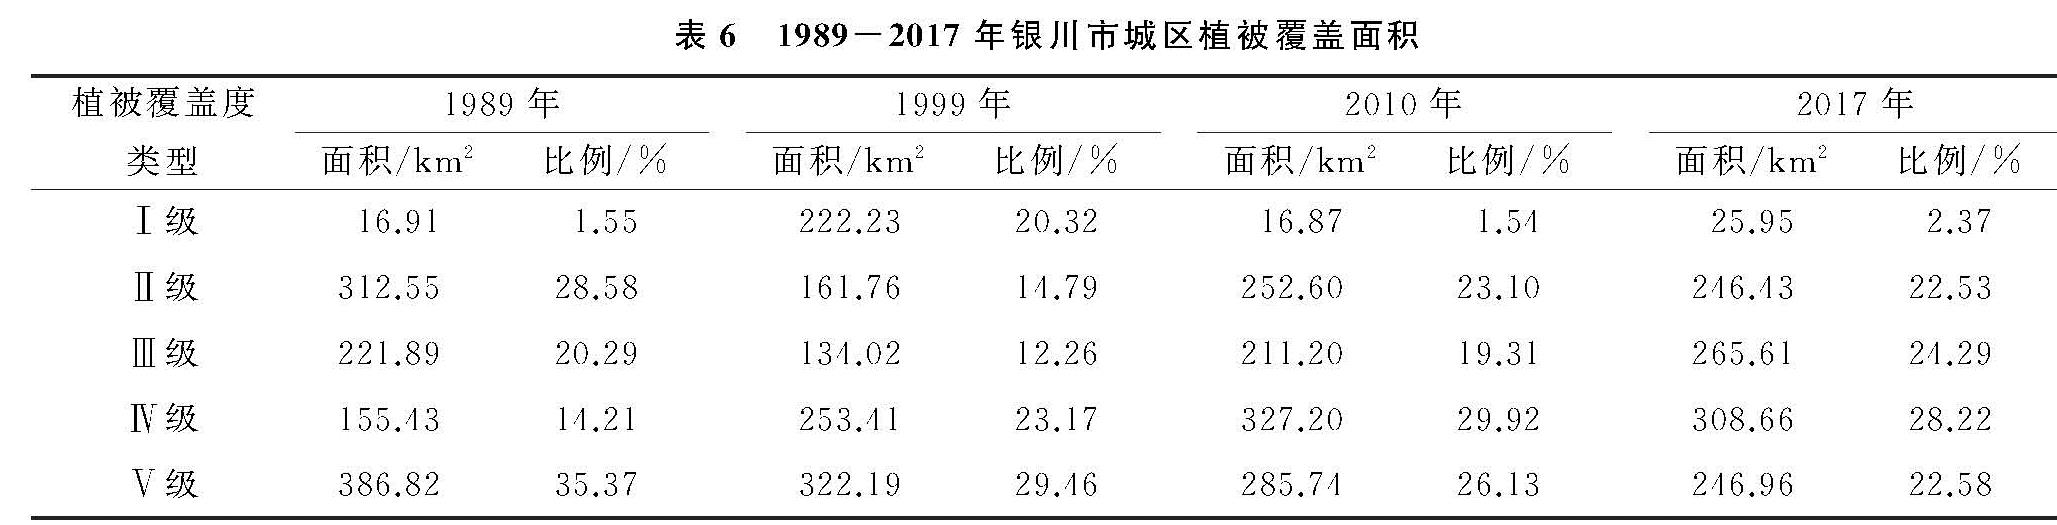
基于像元二分模型计算研究区4个时期的植被覆盖度,将其按照[0,0.4),[0.4,0.5),[0.5,0.6),[0.6,0.7),[0.7,1]分为无植被覆盖区(Ⅰ级)、极低植被覆盖度(Ⅱ级)、低植被覆盖度(Ⅲ级)、中植被覆盖度(Ⅳ级)和高植被覆盖度(Ⅴ级)5个等级并对各等级面积进行统计(图5,表6)。结果表明:研究区植被覆盖度总体表现出东部相对较高、西部较低的特点,覆盖等级较高的植被多分布在城市建成区周边,土地利用类型主要为耕地。1989—1999年植被退化,植被覆盖度下降,Ⅰ级裸地面积比例上升18.77%,Ⅱ级和V级植被面积比例分别下降13.79%,5.91%; 1999—2010年植被覆盖度增加,植被恢复,Ⅰ级植被面积比例下降18.78%,Ⅲ级和Ⅳ级植被面积比例分别上升7.05%,6.75%; 2010—2017年,植被覆盖度减小,植被退化,Ⅲ级植被面积增加最多,比例上升了4.98%,V级植被面积减小最多,比例下降了3.55%,28 a间研究区植被覆盖度较高且整体呈现减小趋势,植被表现为退化—恢复—退化的变化过程。从空间分布上看,1989年贺兰山山前的极低植被覆盖区逐渐转变为中、高植被覆盖区,土地利用类型由未利用土地转变为耕地,植被增加明显; 而由于城市的快速扩展,研究区东部、北部和南部区域植被出现退化,由中高转化为极低和低类型,植被覆盖度降低。
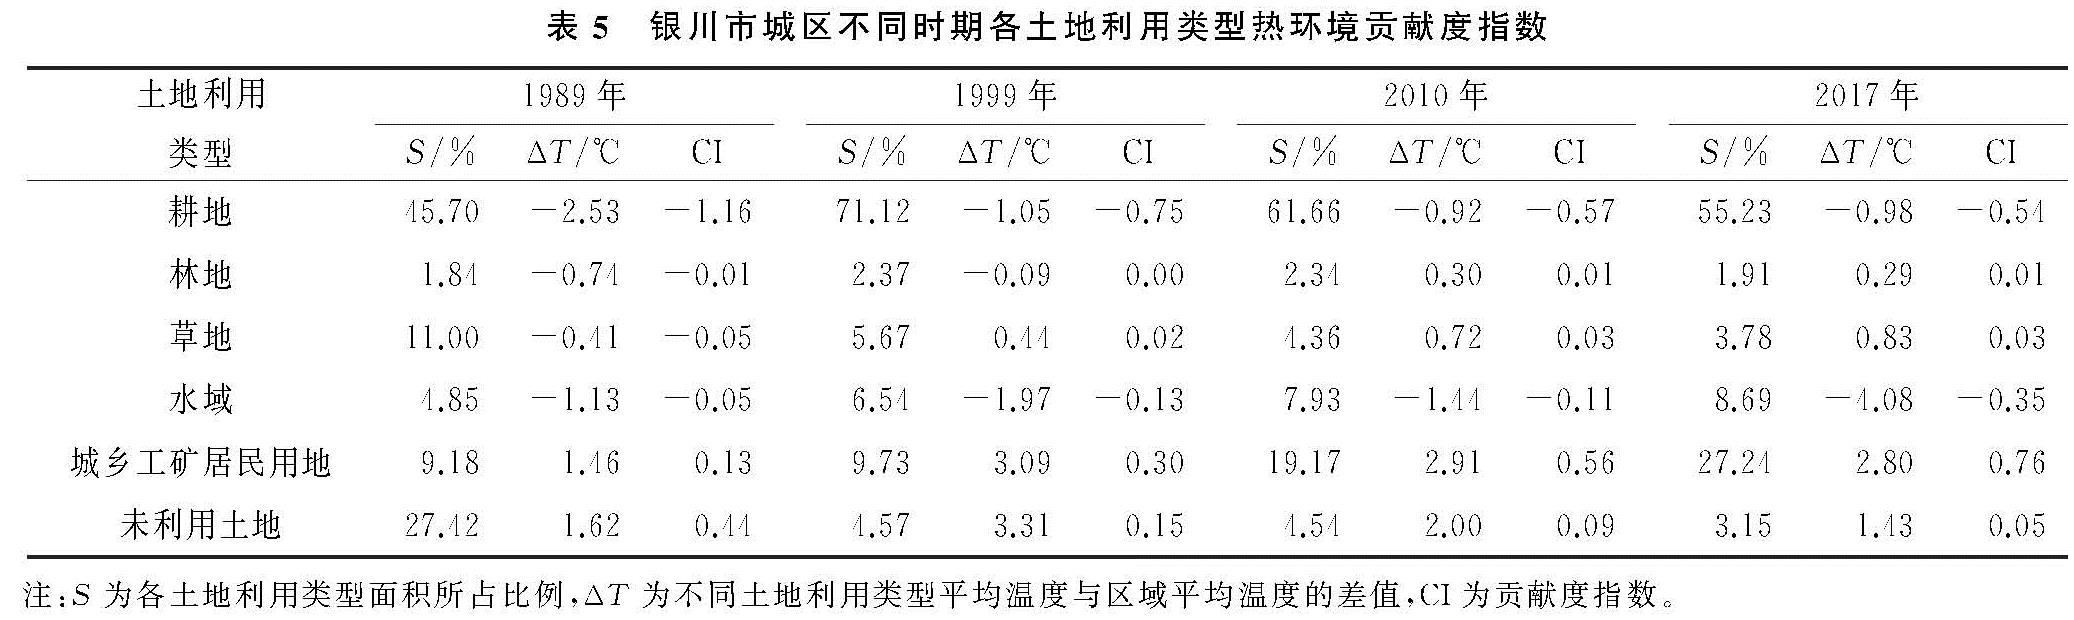
表5 银川市城区不同时期各土地利用类型热环境贡献度指数
图5 1989-2017年银川市城区植被覆盖度空间格局分布
3.5.2 植被覆盖度与地表温度的关系
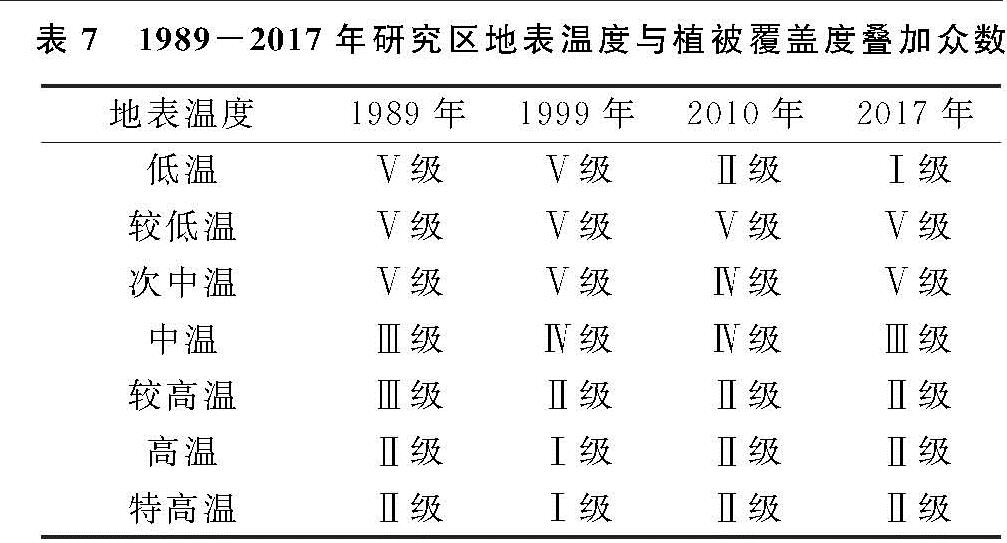
将研究区4个年份的LST和植被覆盖度进行空间叠加分析,并统计不同等级地表温度中各植被覆盖等级的众数(表7),结果表明:构成热岛的较高温区、高温区和特高温区主要为Ⅰ级、Ⅱ级和Ⅲ级植被,而非热岛区域Ⅳ级和Ⅴ级植被为主; 此外,随机生成789个采样点(点间距为500 m),对不同时期的LST和植被覆盖度进行相关分析,结果显示其相关系数分别为-0.78,-0.79,-0.70,-0.39,均通过1%的显著性检验。由此可见,研究区不同时期的地表温度与植被覆盖度呈负相关关系,在地表温度较高的区域,植被覆盖度较低; 而地表温度较低的区域植被覆盖度较高。
表7 1989-2017年研究区地表温度与植被覆盖度叠加众数