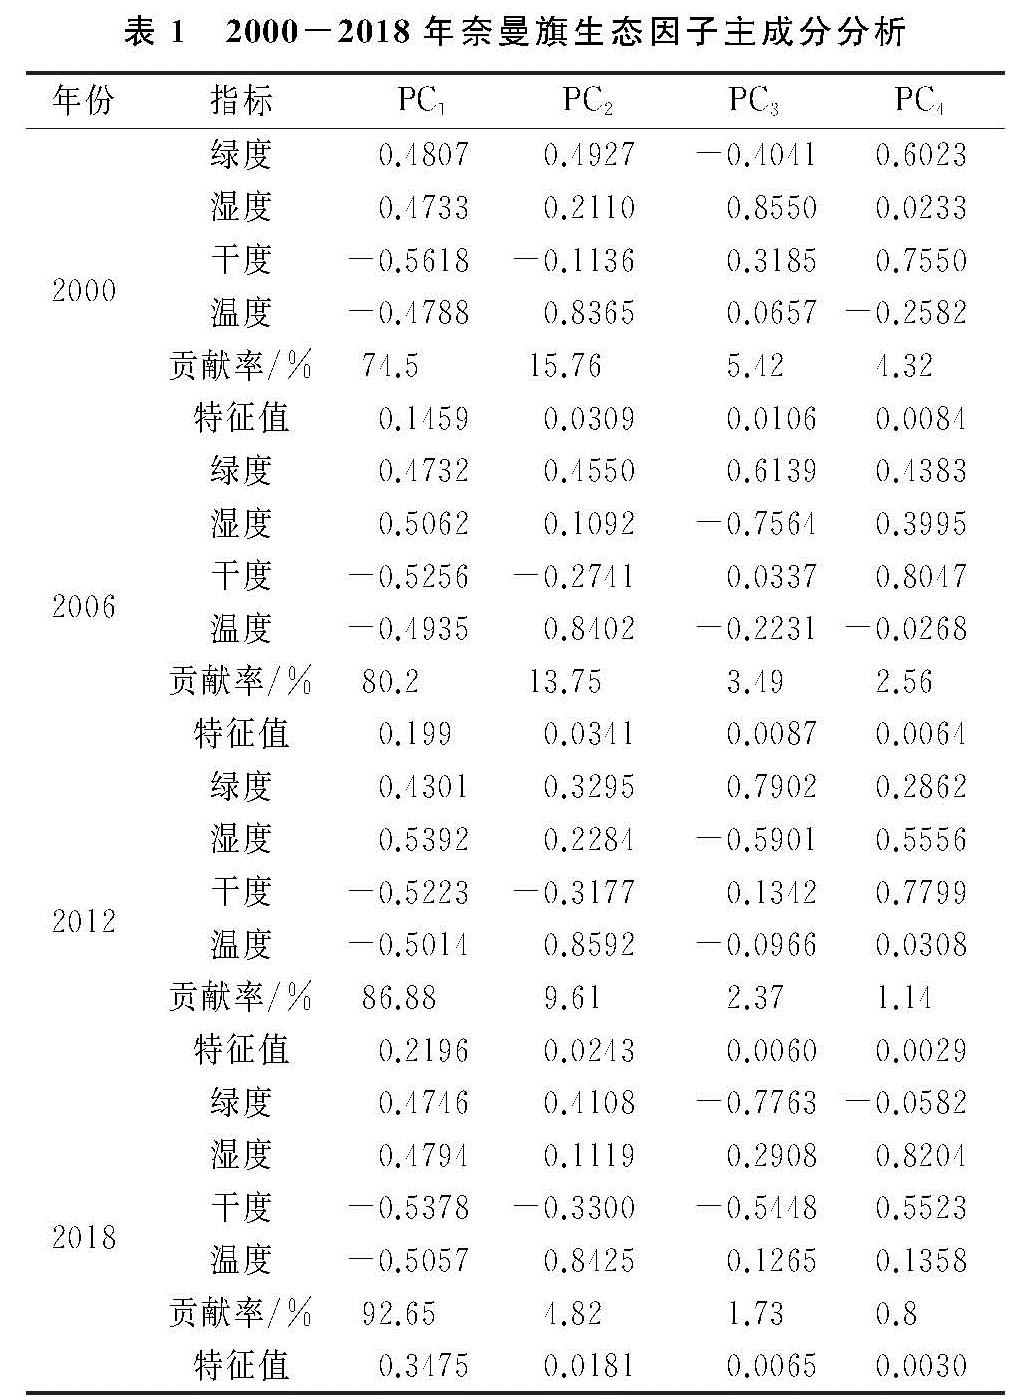
3.1 RSEI构建与指标分析
由表1可以看出,奈曼旗2000—2018年生态因子第一主成分贡献率均大于70%,分别为74.55%,80.2%,86.88%和92.65%,说明第一主成分PC1集合了4个指标大部分特征,其绿度和湿度均呈正值,这可以被理解为二者共同对生态环境质量变化起到正面作用,干度和热度均呈负值,二者共同起到了负面作用,PC2,PC3和PC4中各个指标与实际情况不相符,难以解释实际的生态现象,这与的实际情况和研究思路基本相吻合,因此RSEI的构建采用第一主成分。
3.2 奈曼旗生态环境质量整体分析
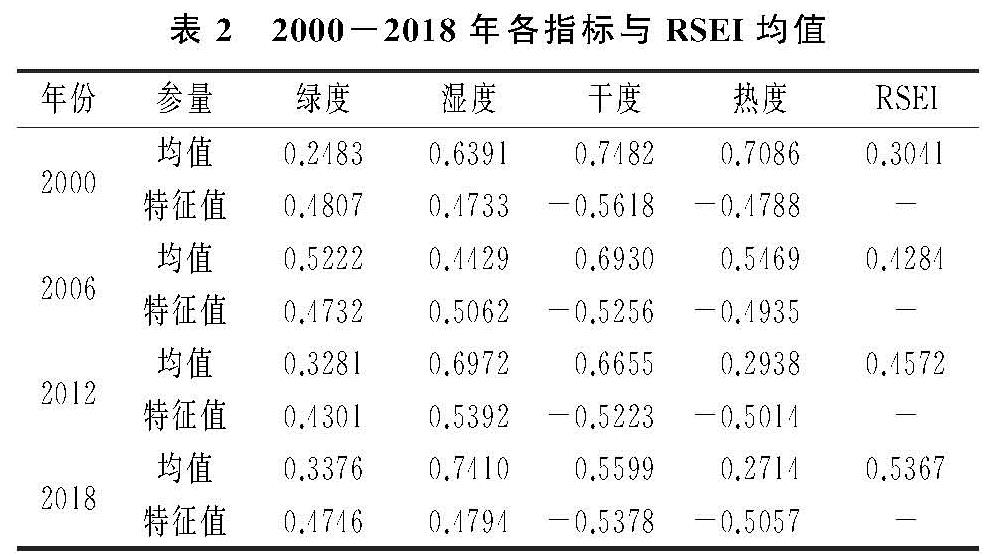
构建RSEI生态指数模型,对2000—2018年奈曼旗生态环境质量进行整体分析(表2),2000—2018年奈曼旗RSEI均值由0.304 1上升到0.536 7,涨幅为76.49%,生态环境质量整体呈高速改善趋势; 对生态环境质量起正面作用的绿度和湿度均值在2000—2018年涨幅分别为35.96%和15.94%,起负面作用的干度和热度均值呈下降趋势,减少幅度分别为25.17%和61.70%; 由各指标特征值的绝对值看出湿度和干度的值较大,说明主要影响奈曼旗生态环境质量的指数为湿度和干度。
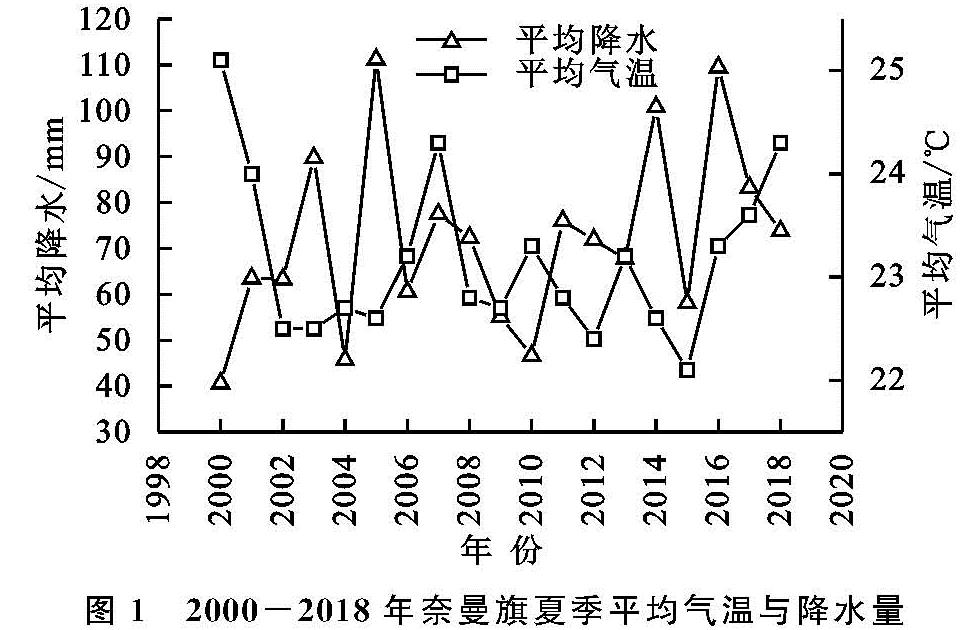
为进一步验证本文计算的各个因子的准确性,统计2000—2018年奈曼旗夏季的平均气温和降水量(图1),可以得出降水量由2000年的40.6 mm上升为2018年的73.8 mm,气温由25.1℃下降到了24.3℃,降水和气温能够间接的反映各个指标变化规律,这与本文各指标变化规律基本一致。
表1 2000-2018年奈曼旗生态因子主成分分析
3.3 奈曼旗生态环境质量时空变化分析
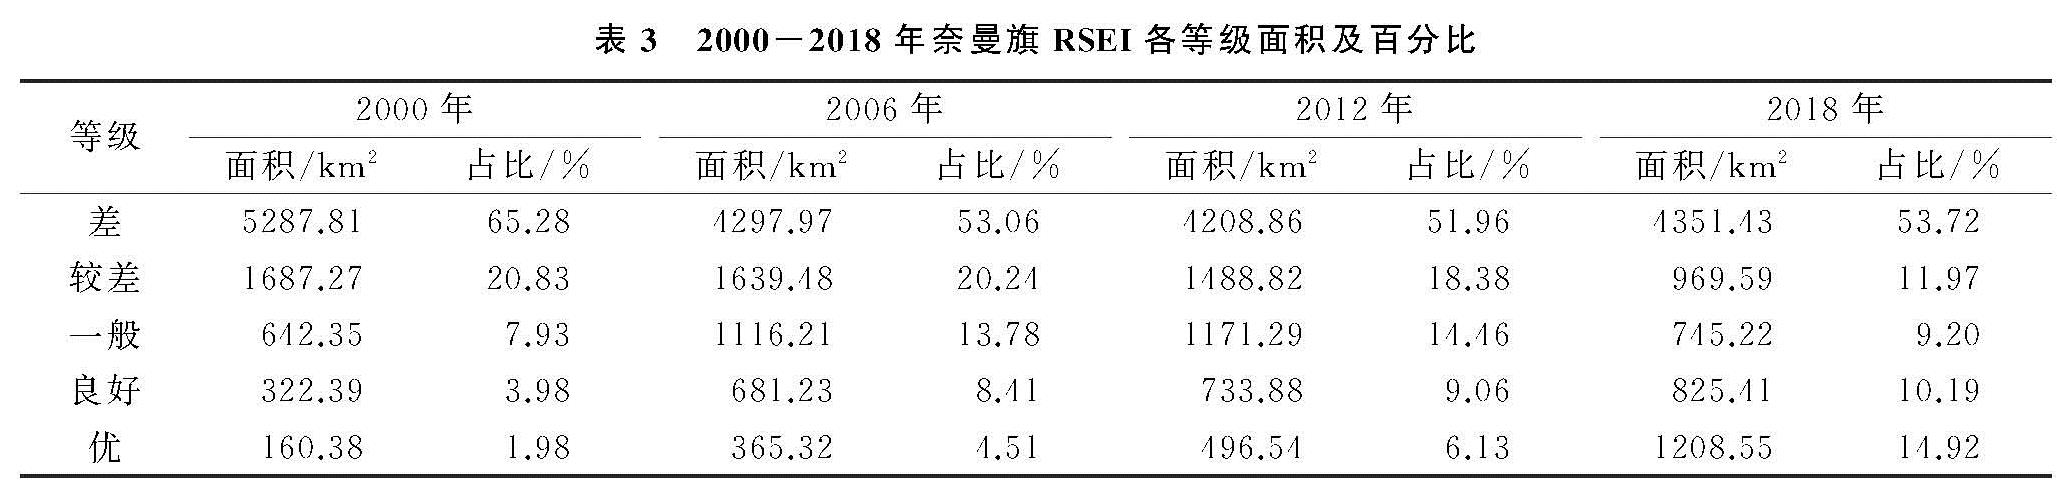
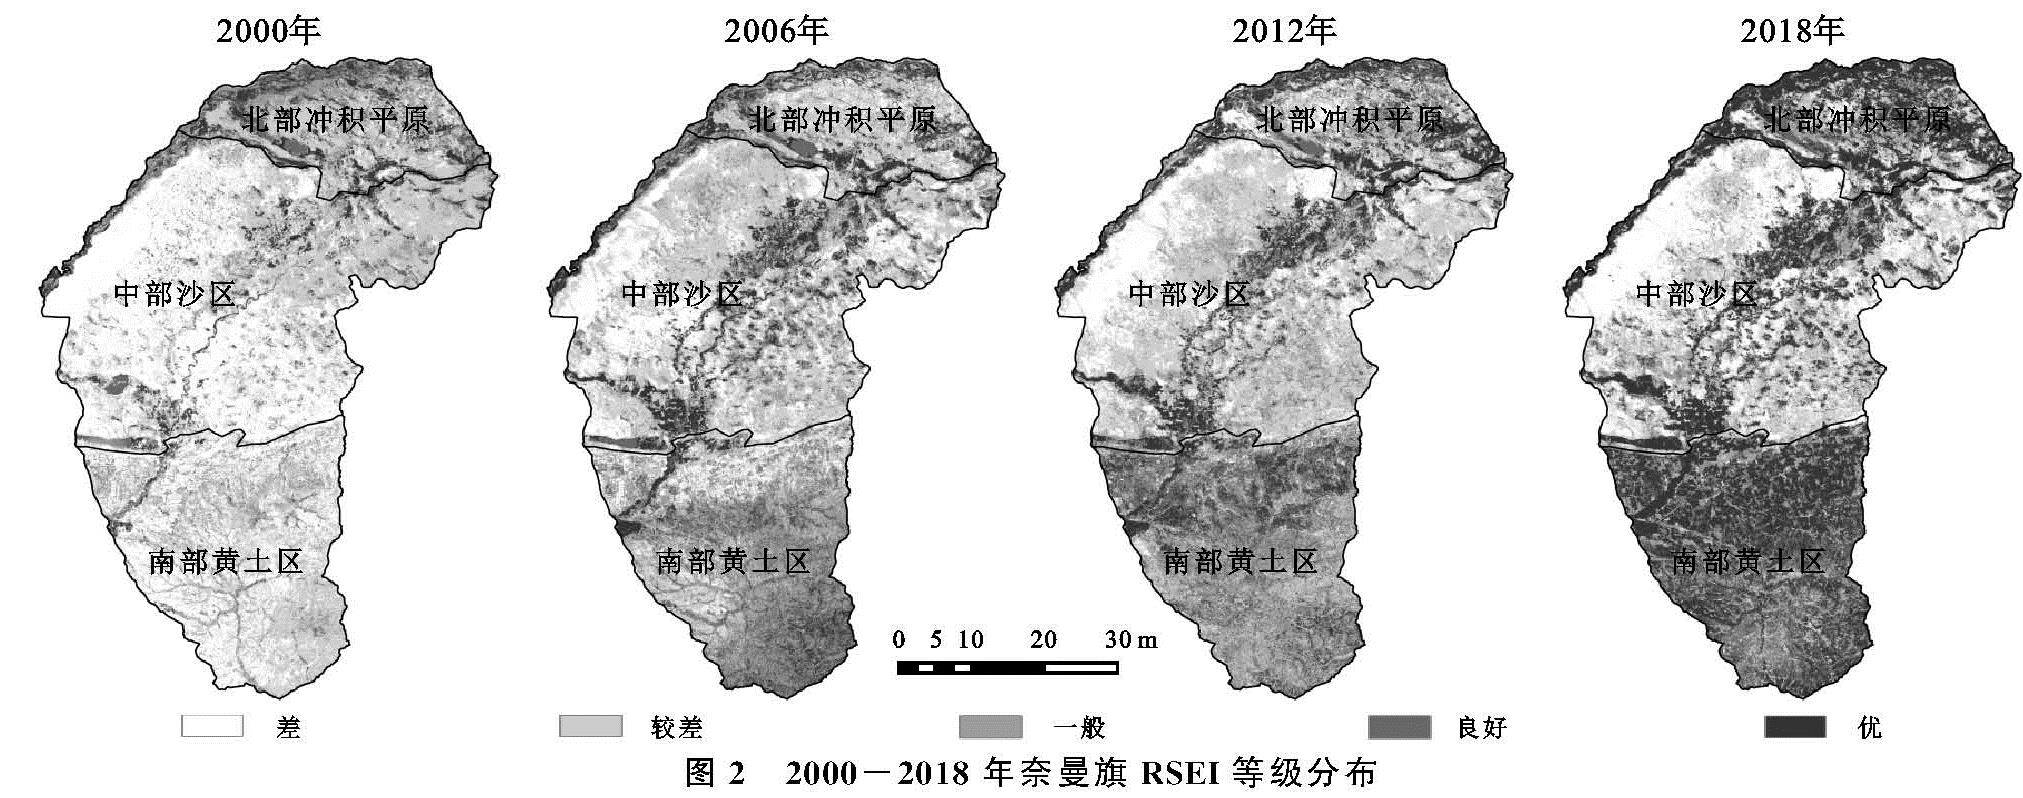
为更好地对比奈曼旗各年份RSEI生态指数,了解RSEI在空间上的分布情况,将RSEI值以0.2为间隔分为5个等级,分别为差、较差、一般、良好和优[11],统计各等级面积及占比(表3)。
2000—2018年奈曼旗生态环境差和较差的地区面积所占比例分别为86.11%,73.3%,70.34%和65.69%,呈逐年减少趋势,共减少了1 654.06 km2,属于高速衰退型,其中生态环境差的面积在2012—2018年出现上涨趋势,但上涨幅度较小,所占比例增加了1.76%,较差的面积则呈现逐年下降趋势; 生态环境一般的面积呈现逐年增加趋势,增涨了102.87 km2,所占比例仅增加了1.27%; 良好和优等级呈现逐年增加趋势,共增加面积1 551.19 km2,其中生态环境质量优等级的面积所占比例由2000年1.98%上涨到2018年14.92%,共上涨了12.31%,属于高速扩展型; 由此看出奈曼旗的生态环境质量主要是差和较差为主,但所占比例逐年减少,良好和优所占比例逐年增涨,总体来看其生态环境质量的到改善。
图1 2000-2018年奈曼旗夏季平均气温与降水量
为更加直观的了解RSEI生态指数各等级在空间上的分布情况,本文根据地势地貌将奈曼旗分为3个亚区进行分析(
图2),3个亚区分别为南部黄土区、中部沙区和北部冲积平原区
[24];,2000年差和较差等级几乎占据了整个中部沙区和南部黄土区,优和良好零星分布在北部冲积平原区和中部沙区,生态环境质量较低,其主要原因之一是人口的增加对自然资源的需求量增加,政府实施的生态环境治理措施滞后; 2006年差和较差等级主要分布在中部沙区和北部冲积平原区,较2000年差等级面积减少,较差等级占主导地位,南部黄土区主要分布为一般和良好等级,紧挨中部沙区还有差和较差等级分布,但生态环境恢复效果明显; 2012年差和较差等级主要分布亚区较2006年无明显变化,其中一部分差等级转化为较差等级,北部冲积平原区一般和良好等级面积明显增加,较2006年,一般和良好等级几乎分布在整个南部黄土区; 2018年可以明显看出北部冲积平原区优等级的面积增加,差和较差等级只是零星分布,中部沙区依旧由差和较差等级占主导地位,并且西部主要沙区的差等级面积有些增加,生态环境质量出现局部恶化,南部黄土区变化最为明显,一般等级大部分向优和良好等级转移。
总体上来看奈曼旗生态环境改善效果明显,其改善的主要因素可以分为自然和人为因素,其中自然因素主要包括2000—2018年奈曼旗植物生长季的降水逐渐增加,温度小幅度上涨,地表植被得到充足的水源,使得各沙化土地面积减少,林草地面积增加; 人为因素主要包括奈曼旗经济的不断发展,人们对薪柴的需求降低,滥砍滥发现象减少,以及“三北防护林”体系、退耕还林还草、退牧还草、舍饲禁牧等一系列的生态环境治理政策的实施,使得奈曼旗生态环境质量逐渐好转。
表3 2000-2018年奈曼旗RSEI各等级面积及百分比
3.4 奈曼旗生态环境质量差值分析
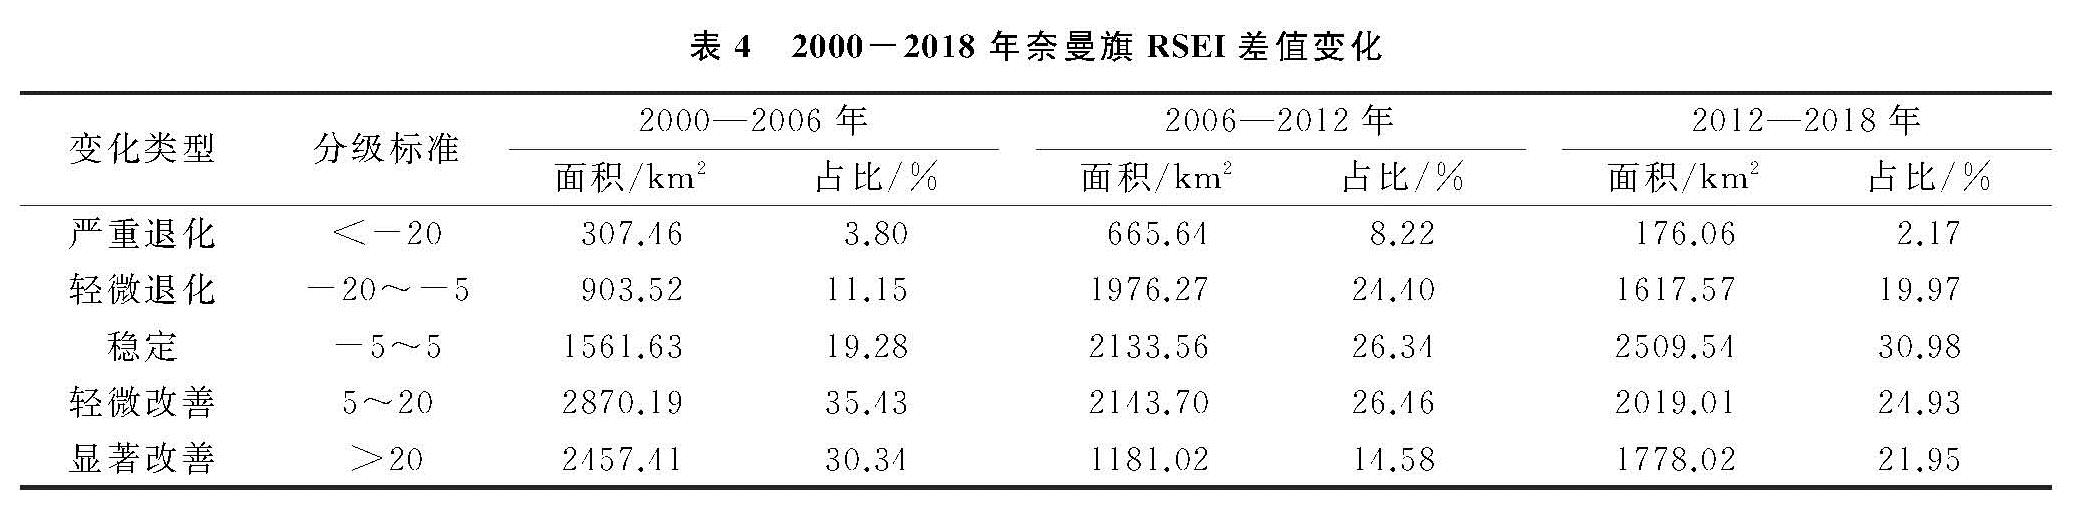
为揭示奈曼旗生态环境质量2000—2006年、2006—2012年、2012—2018年3个时间段上的动态变化,分析各时间段RSEI生态指数的差值,并参考《生态环境状况评价技术规范》和文献,将变化类型分为严重退化、轻微退化、稳定、轻微改善和显著改善5个等级[25-26]。
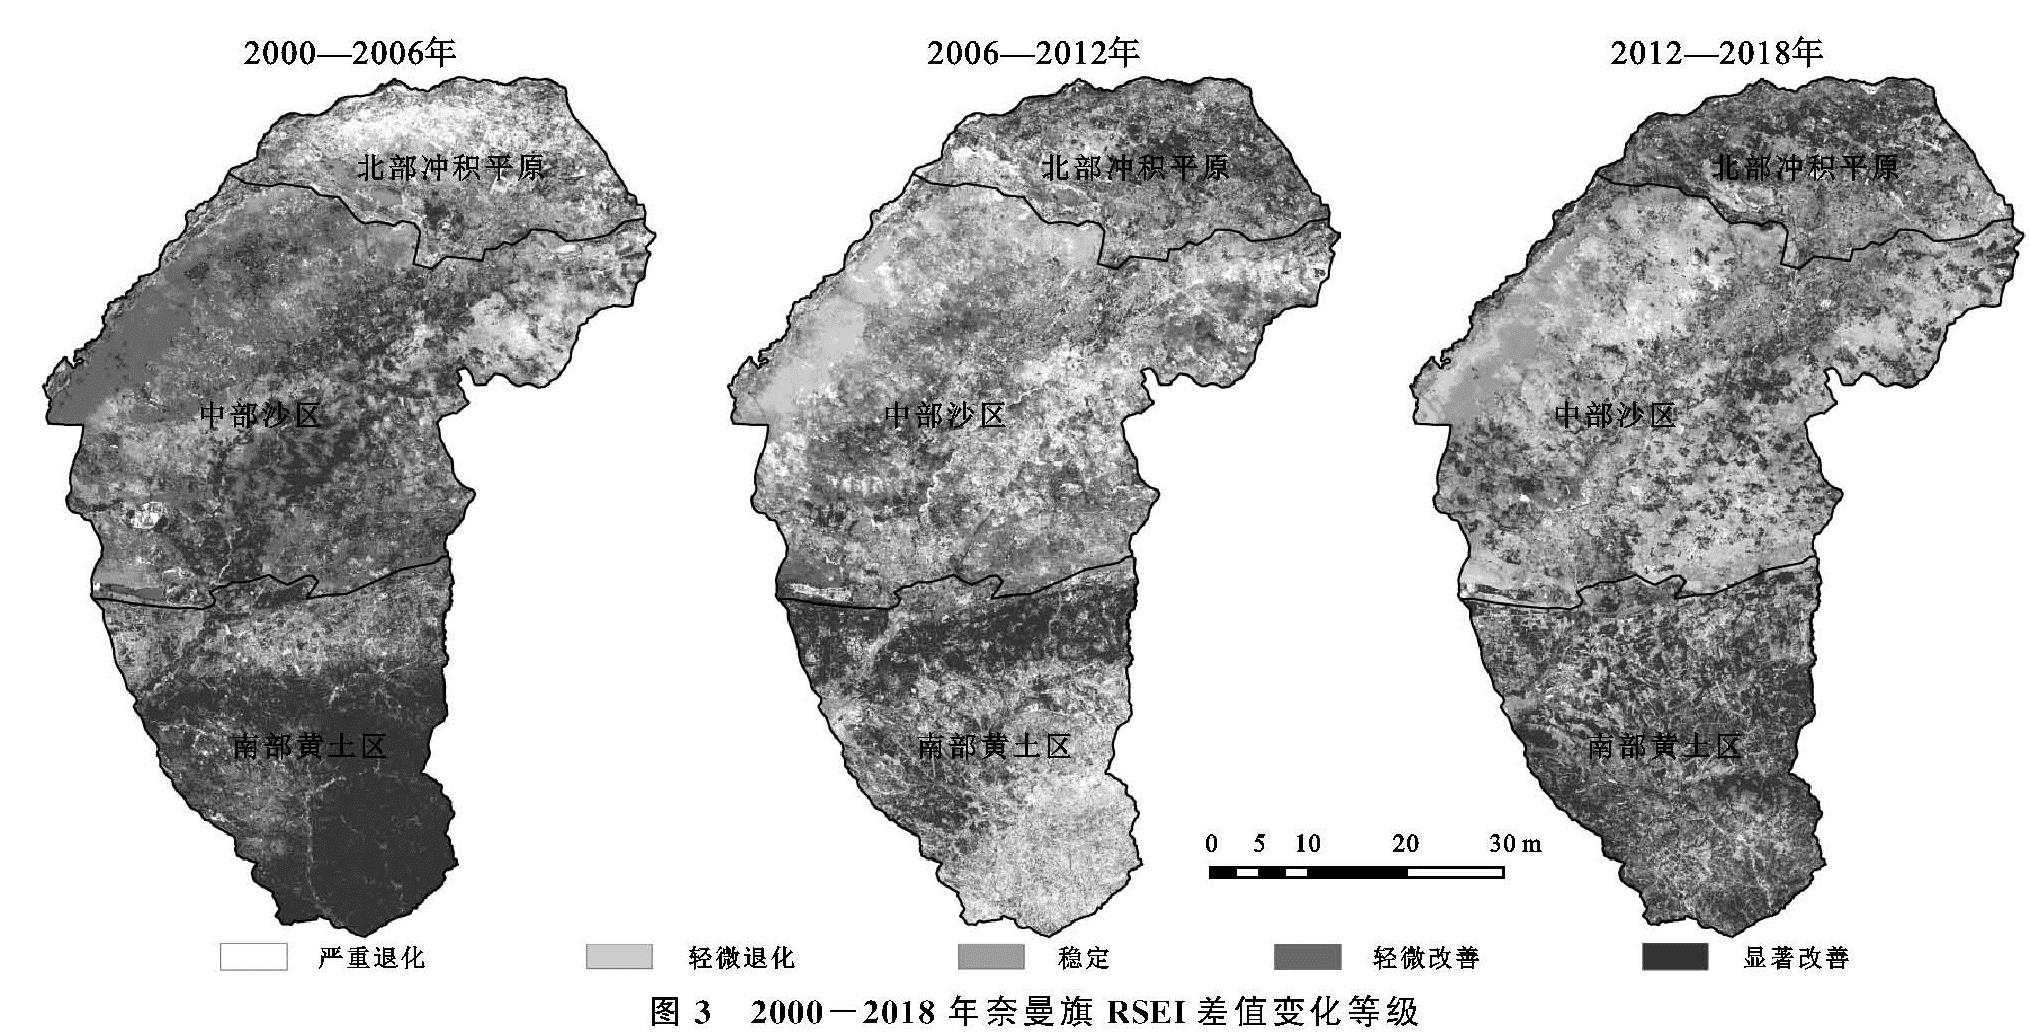
结合表4和图3分析,第一时间段奈曼旗生态环境质量改善面积达到5 327.6 km2,占总面积的65.77%,其中以轻微改善为主,主要变好区域为中部沙区和南部黄土区,其中显著改善主要集中在耕地为主的南部黄土区,这说明生态环境建设工程起到了积极作用,变差区域仅占总面积的14.95%,且以轻微退化为主,主要集中在北部冲积平原区; 第二时间段相较于第一时间段生态环境质量改善程度较为缓慢,面积总和为3 324.72 km2,面积占比降低了2.73%,稳定面积增加了571.93 km2,部分区域出现退化趋势,其以中轻微退化为主,为1 976.27 km2,面积占比相较于第一时间段增加了13.25%,退化区域主要分布在中部沙区和南部黄土区,这与2006—2012年降水减少导致地表植被长势较差以及城镇化建设导致的土地利用结构不平衡有着密不可分的关系; 第三时间段,生态环境质量以稳定为主,面积达到了2 509.54 km2,占总面积的30.98%,改善区域集中在北部冲积平原区和南部黄土区,面积3 797.03 km2,占总面积的46.88%,生态环境质量退化区域主要以轻微退化为主,面积为1 617.57 km2,占总面积的19.97%,主要分布在中部沙区,只有零星区域出现严重退化,只占总面积的2.17%,中部沙区退化的主要因素是不合理的人为扰动导致沙化土地自然环境被破坏。
2000—2018年生态环境质量改善区域面积均大于退化区域,2000—2006年达到了峰值,后期改善和退化面积逐渐减少,稳定面积逐渐占据主导地位,这表明生态环境治理措施已逐渐成熟,效果显著。总体上来看奈曼旗生态环境质量呈逆转趋势,并逐渐趋于稳定,但局部区域仍然会出现退化现象,需继续加大生态环境治理。
图3 2000-2018年奈曼旗RSEI差值变化等级