2.1 气温变化趋势
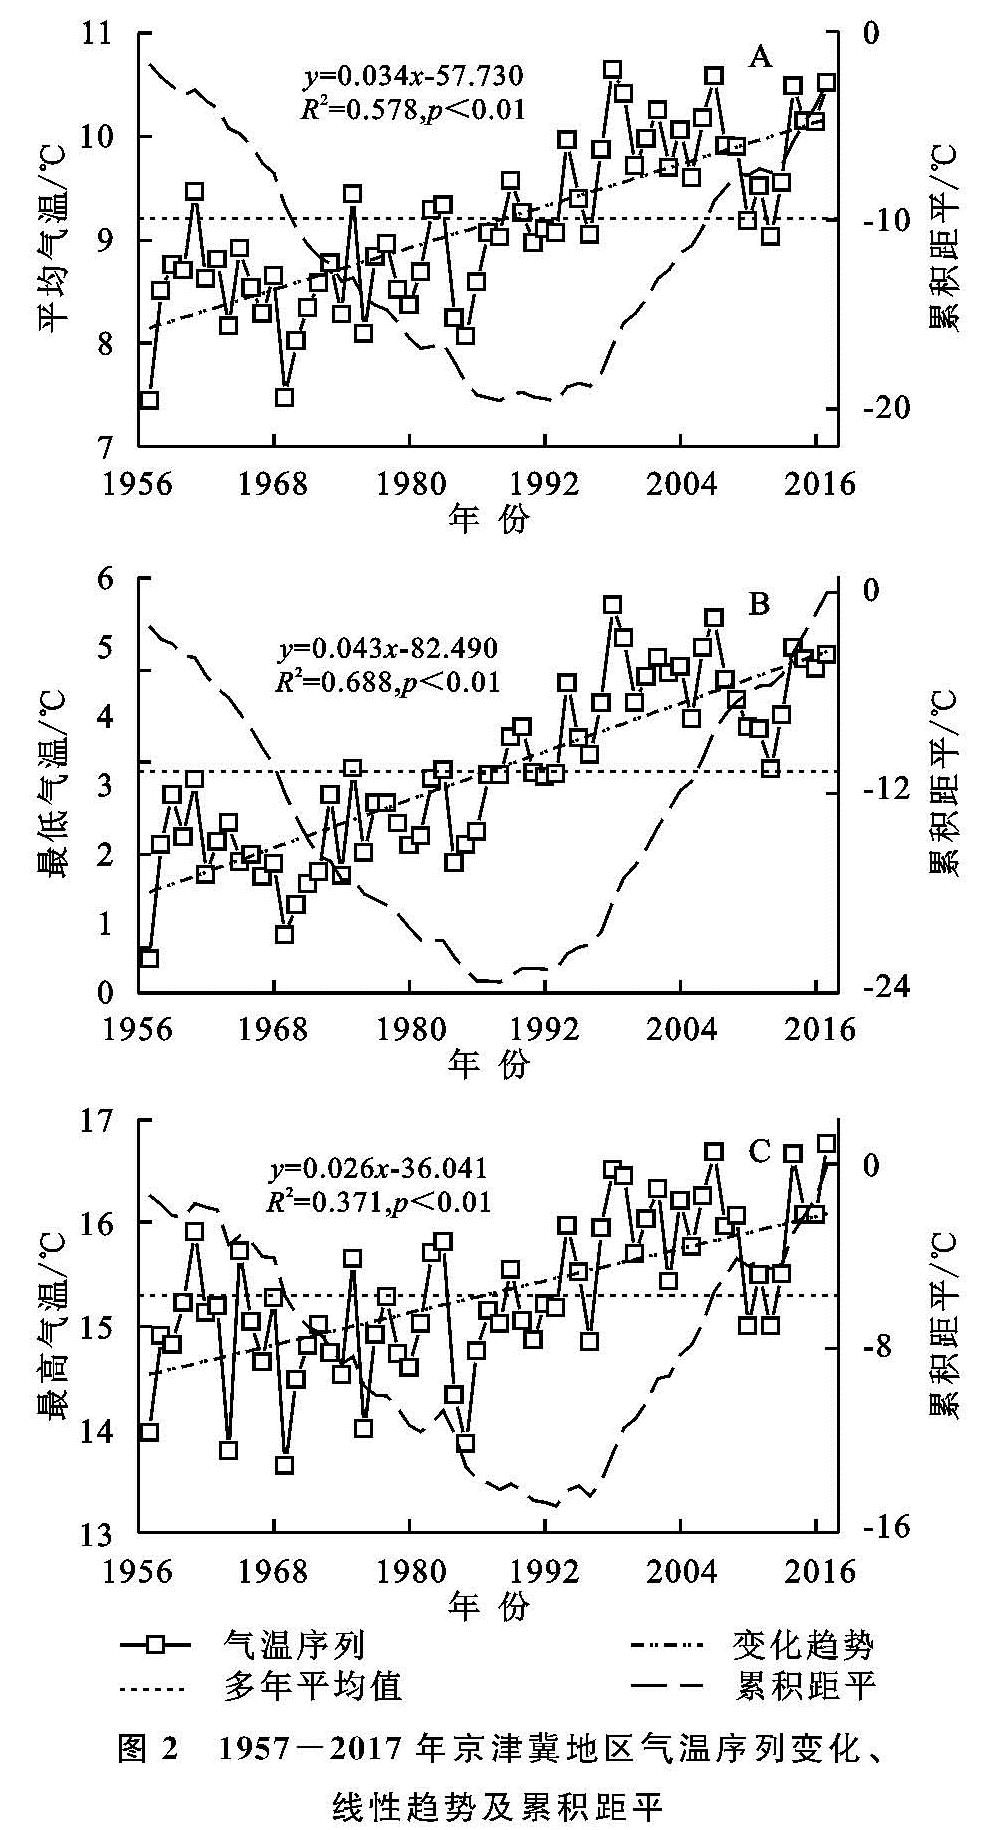
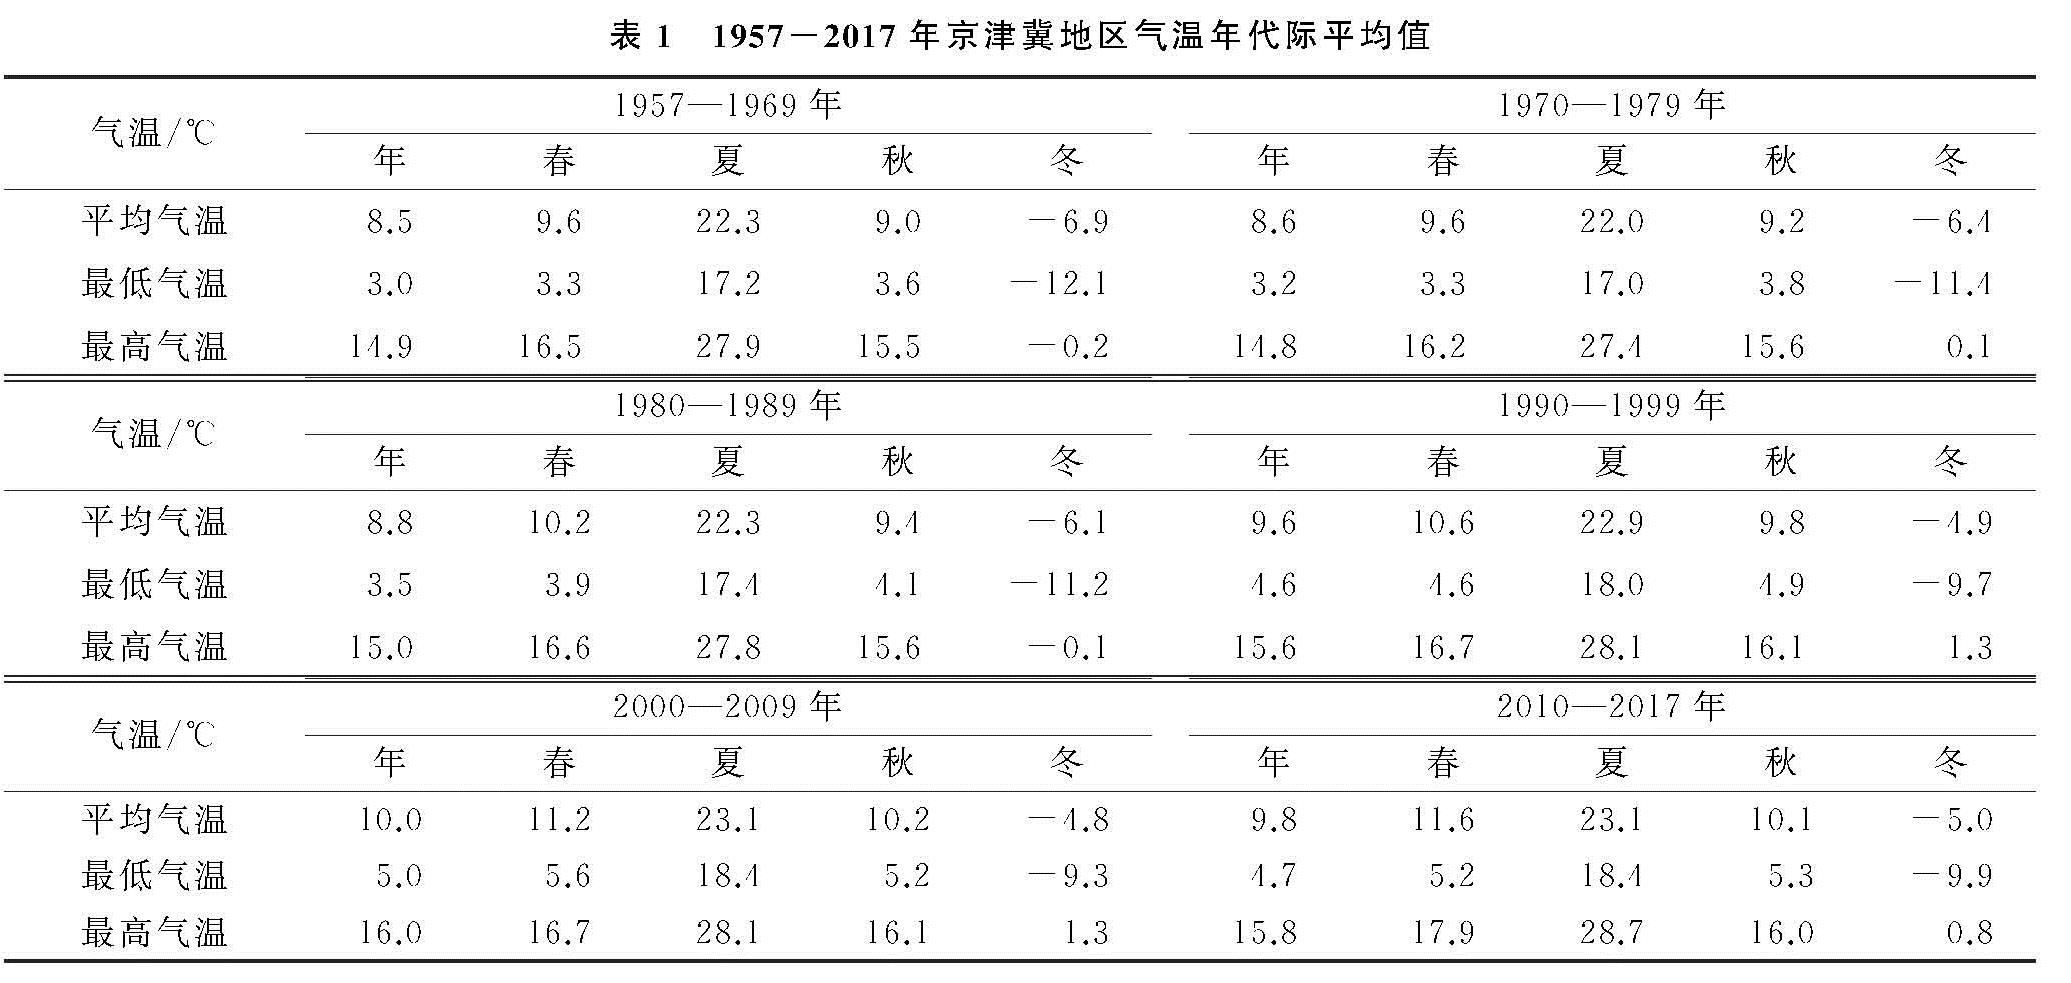
1957—2017年,京津冀地区多年平均气温、最低气温、最高气温分别为9.2,3.9,15.3 ℃,三者均呈显著(p<0.01)升温趋势(图2)。其中,平均气温升温速率为0.34 ℃/10 a,明显高于本区周边的河南(0.19 ℃/10 a)[21]、辽宁(0.20 ℃/10 a)[22]、山东(0.20 ℃/10 a)[23]及山西(0.30 ℃/10 a)[24],低于内蒙古中部地区(0.40 ℃/10 a)[25]。最低气温升温率高达0.43 ℃/10 a,约为最高气温(0.26 ℃/10 a)的1.7倍,即夜间气温较白天气温升高幅度更大,导致气温日较差减小。平均气温和最低气温的变化规律大致相似,分别以1957—1993,1957—1988年为偏冷阶段,期间气温多为负距平,累积距平呈下降趋势,谷值出现在1957年,分别为7.4,1.9 ℃; 偏暖阶段分别为1994—2017年,1989—2017年,期间气温多为正距平,累积距平呈上升趋势,并于1998年达到峰值,分别为10.6,5.7 ℃,该年份同样是辽宁[22]、山西[24]及内蒙古[25]等周边省份有观测记录以来最暖的一年。最高气温年际波动相对较强,距平值及累积距平曲线斜率正负更替频繁,1992年为其偏冷、偏暖阶段的转折年,谷值(13.6 ℃)和峰值(16.8 ℃)则分别出现在1969年、2017年。京津冀地区于20世纪90年代大幅升温,平均气温、最低气温及最高气温相比80年代分别升高约0.8,1.0及0.6 ℃(表1),符合IPCC报告[1]指出的全球变暖幅度自20世纪90年代以来明显加大。
四季气温与全年气温变化趋势相同,且均以最低气温升高最为明显。其中,冬季最低气温、平均气温分别以高达0.58,0.44 ℃/10 a的速度显著(p<0.01)上升,春季升温速率次之,夏季升温最缓; 最高气温升温率自高至低依次为春季>冬季>夏季>秋季。从年代际尺度来看,夏、秋、冬季大幅增温发生在20世纪90年代(表1),春季大幅增温则发生在21世纪初。2011年以来,冬季气温相比上一年代平均值有明显降低,最冷与最暖季气温差异缩小的趋势有所缓和,这可能与我国“气代煤”、“电代煤”及“风电供暖”等冬季清洁取暖工程的持续推动有一定关系[9]。
图2 1957-2017年京津冀地区气温序列变化、线性趋势及累积距平
2.2 气温突变检验
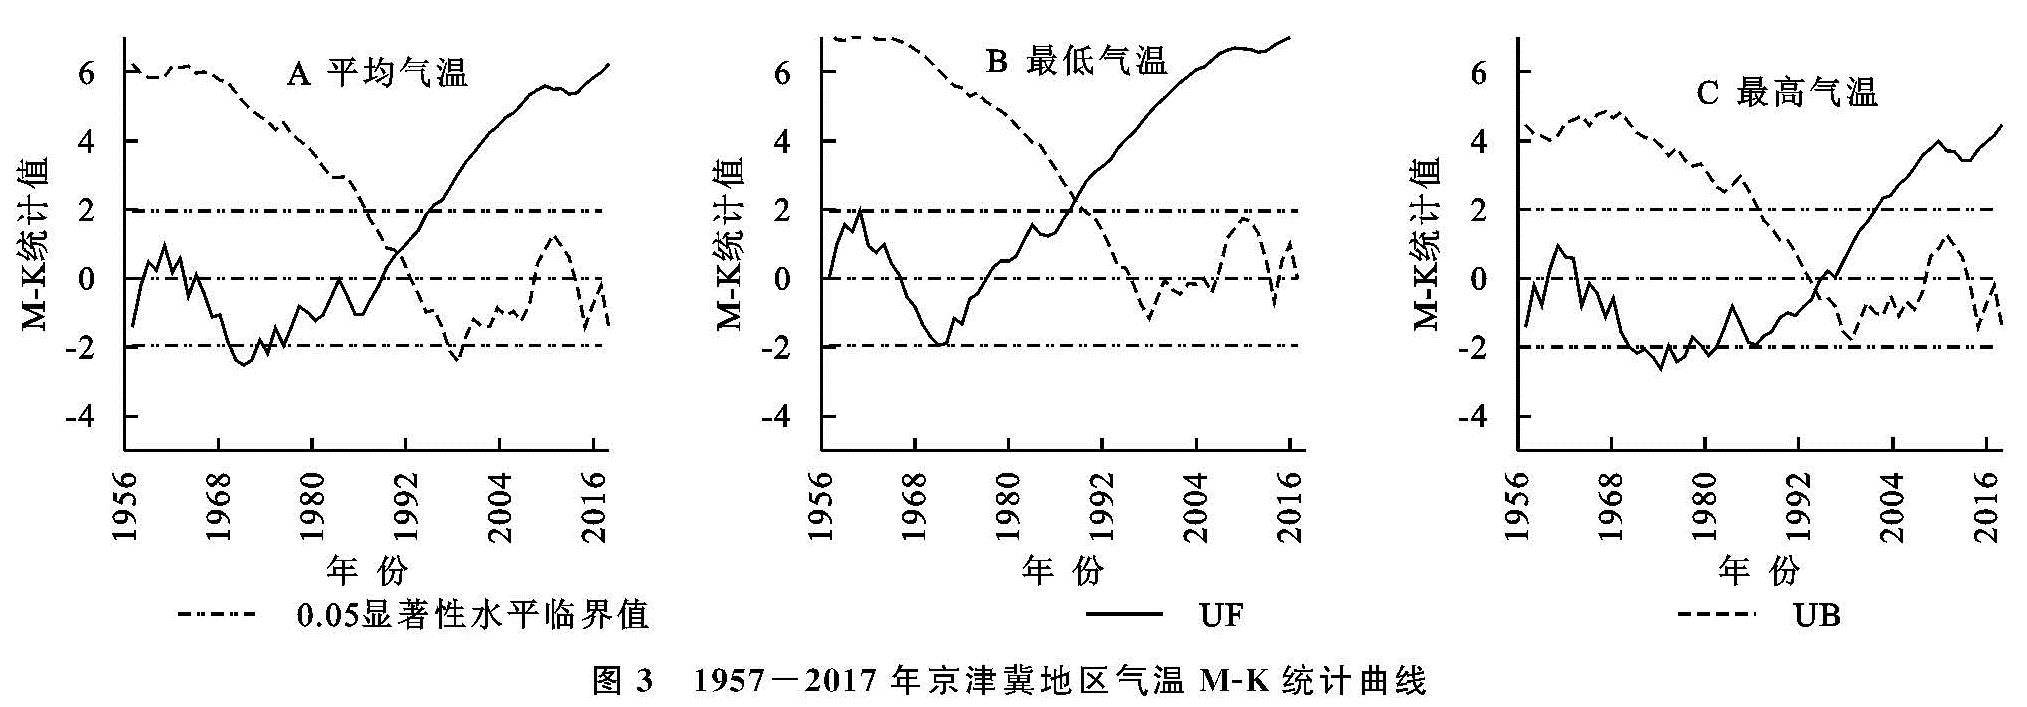
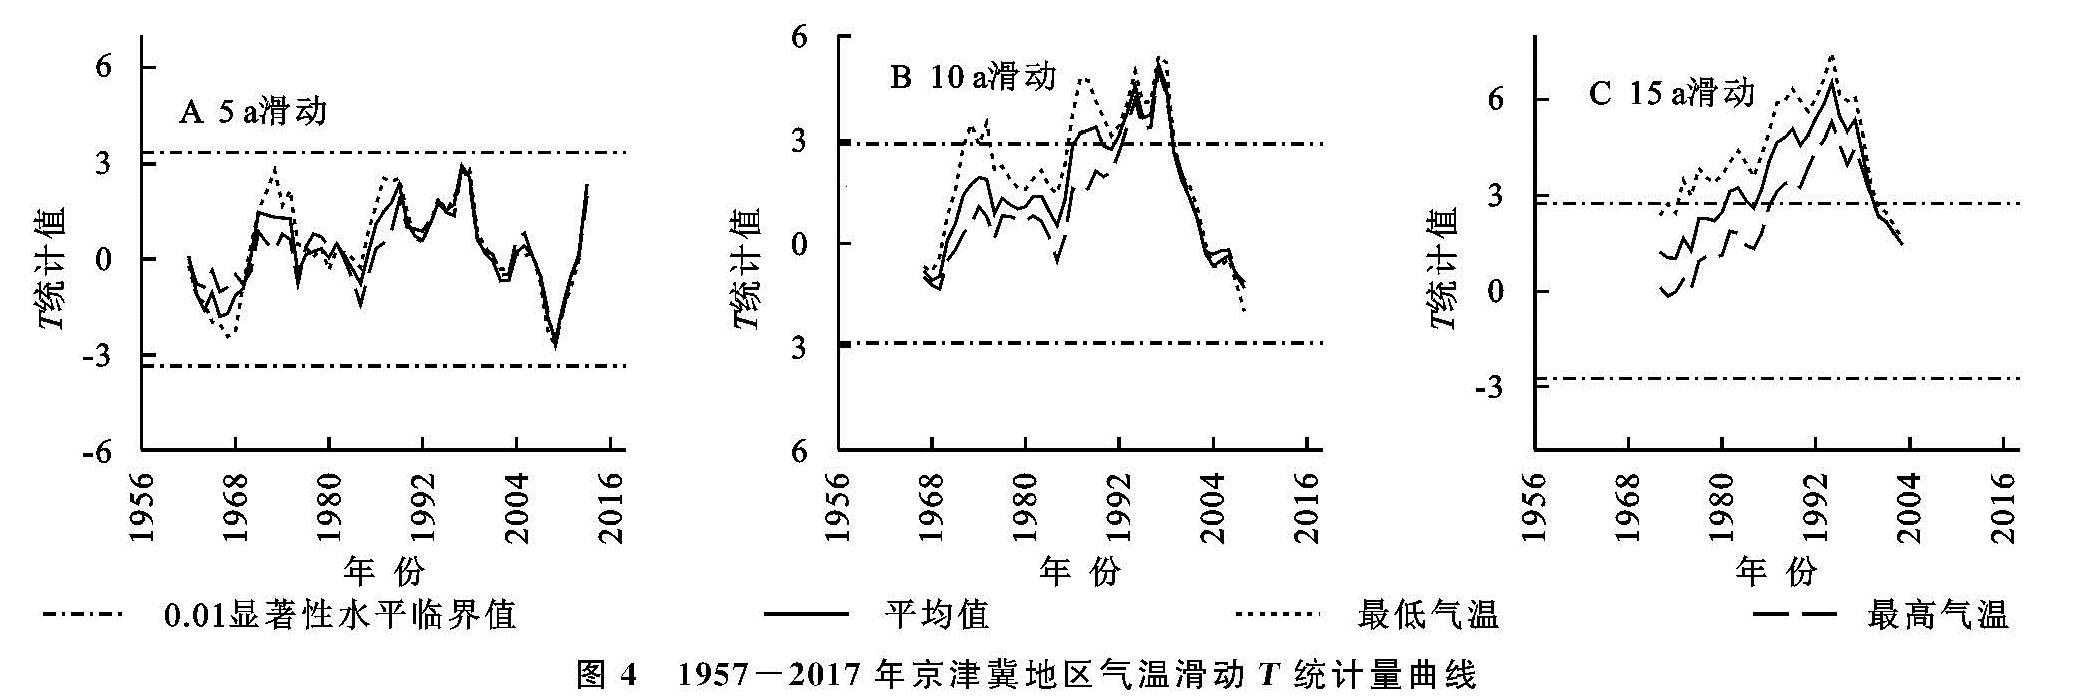
累积距平曲线显示近61 a京津冀地区气温呈先降后升的“V”字型趋势,年最低气温以1988年为转折点最先转暖(图2B),年平均气温及最高气温的转暖则发生在1993年(图2A,C)。根据M-K检验,京津冀地区年平均气温、最高气温的正序列UF曲线与反序列UB曲线分别在1990年、1994年相交于0.05显著性水平范围内(图3A,C),为可能突变点; 最低气温UF,UB曲线在1989年出现交点(图3B),但其位于信度线之外,需进一步检验其是否为突变年份。选取5,10,15 a滑动步长进行滑动T检验(图4),结果表明全年最低气温最早(1970s中期)发生转暖突变,且突变次数最多; 平均气温和最高气温突变分别开始于1980s初和1980s末。此外,由M-K检验及累积距平检测到的突变年份,均通过了滑动T检验0.01显著性水平。
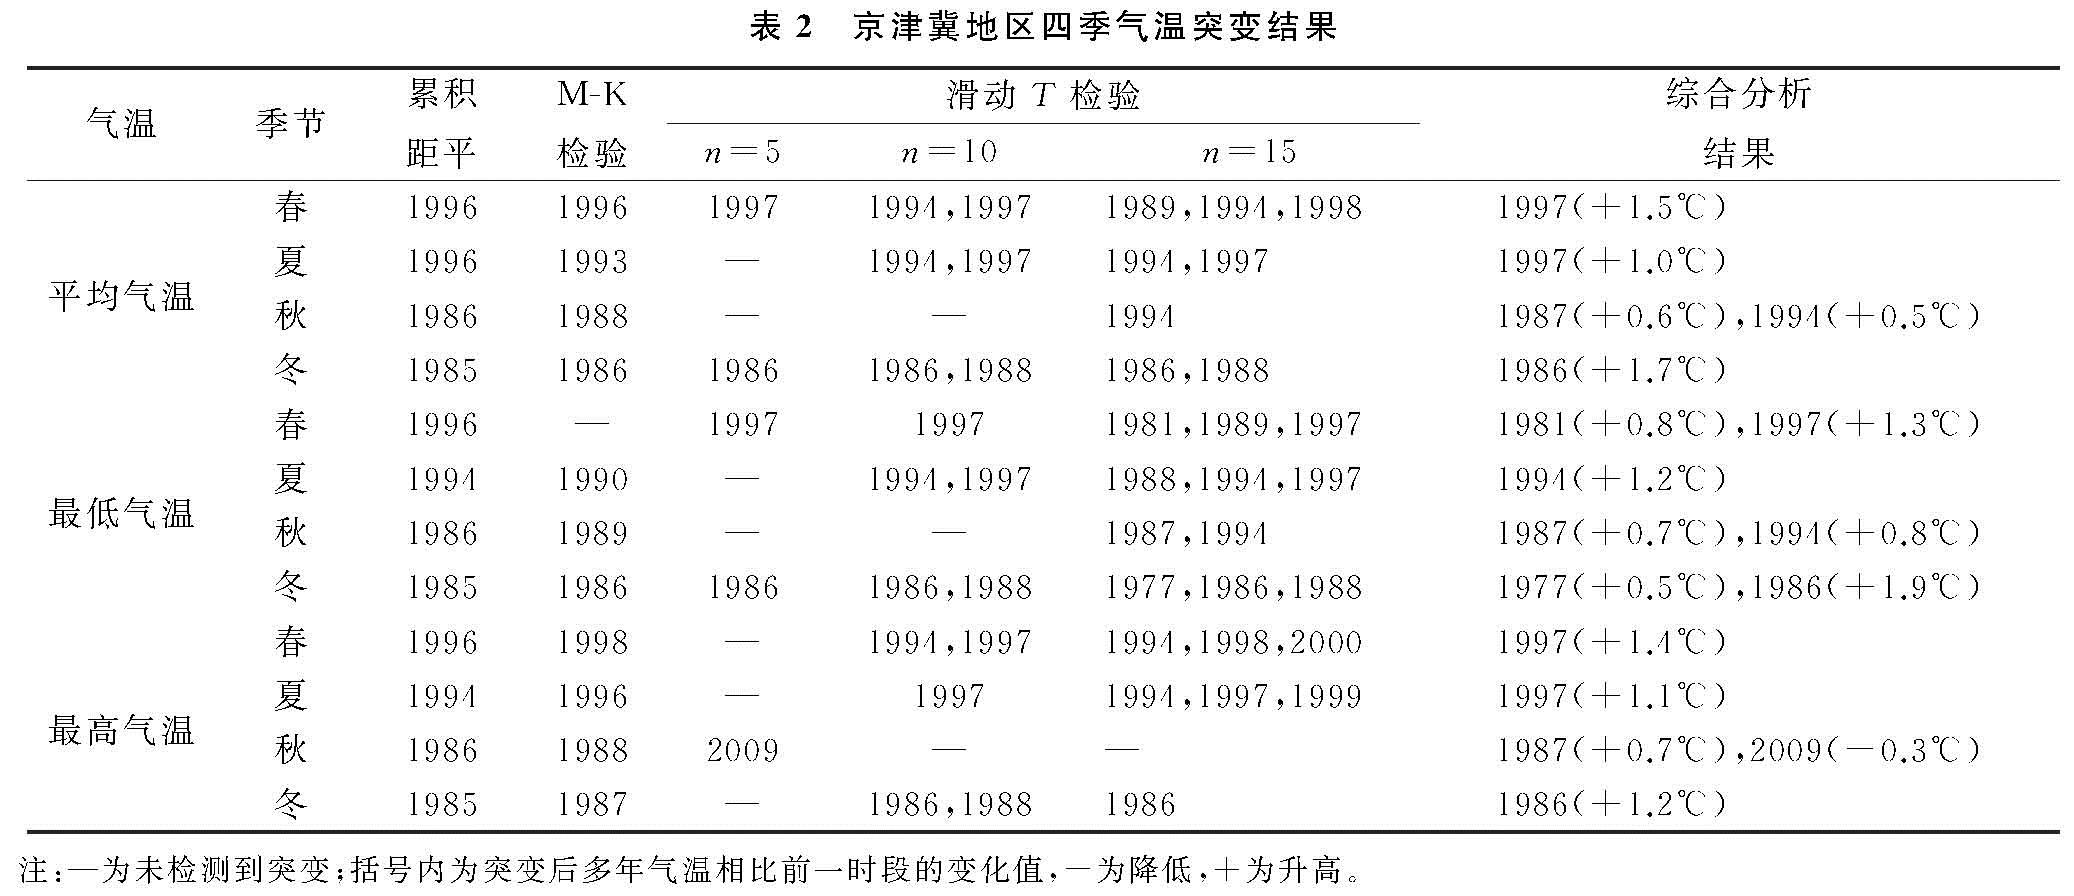
综合M-K检验、累积距平及滑动T检验结果,规定每一气候阶段时间不少于5 a,并选择时段内的最强突变年。梁珑腾等[26]研究表明,我国北方最低气温、平均气温、最高气温突变依次变晚,这在京津冀地区的气温突变中有很好的体现。1957年以来,京津冀地区年平均最低气温于1975年前后发生首次突变,突变后多年平均最低气温升高0.5 ℃。1989年、1997年,最低气温和平均气温均出现突变,突变后多年平均值均提升0.7 ℃。最高气温于1994年发生突变,随后其多年平均值升高1.0 ℃。四季气温突变按发生先后顺序,分别为冬、秋、春及夏季,同样均以最低气温突变发生最早、次数最多,突变后升温幅度最大(表2)。除秋季最高气温在1987年转暖突变后,于2009年发生转冷突变外,其他季节气温突变前后均呈上升趋势。
表1 1957-2017年京津冀地区气温年代际平均值
图3 1957-2017年京津冀地区气温M-K统计曲线
图4 1957-2017年京津冀地区气温滑动T统计量曲线
2.3 气温周期分析
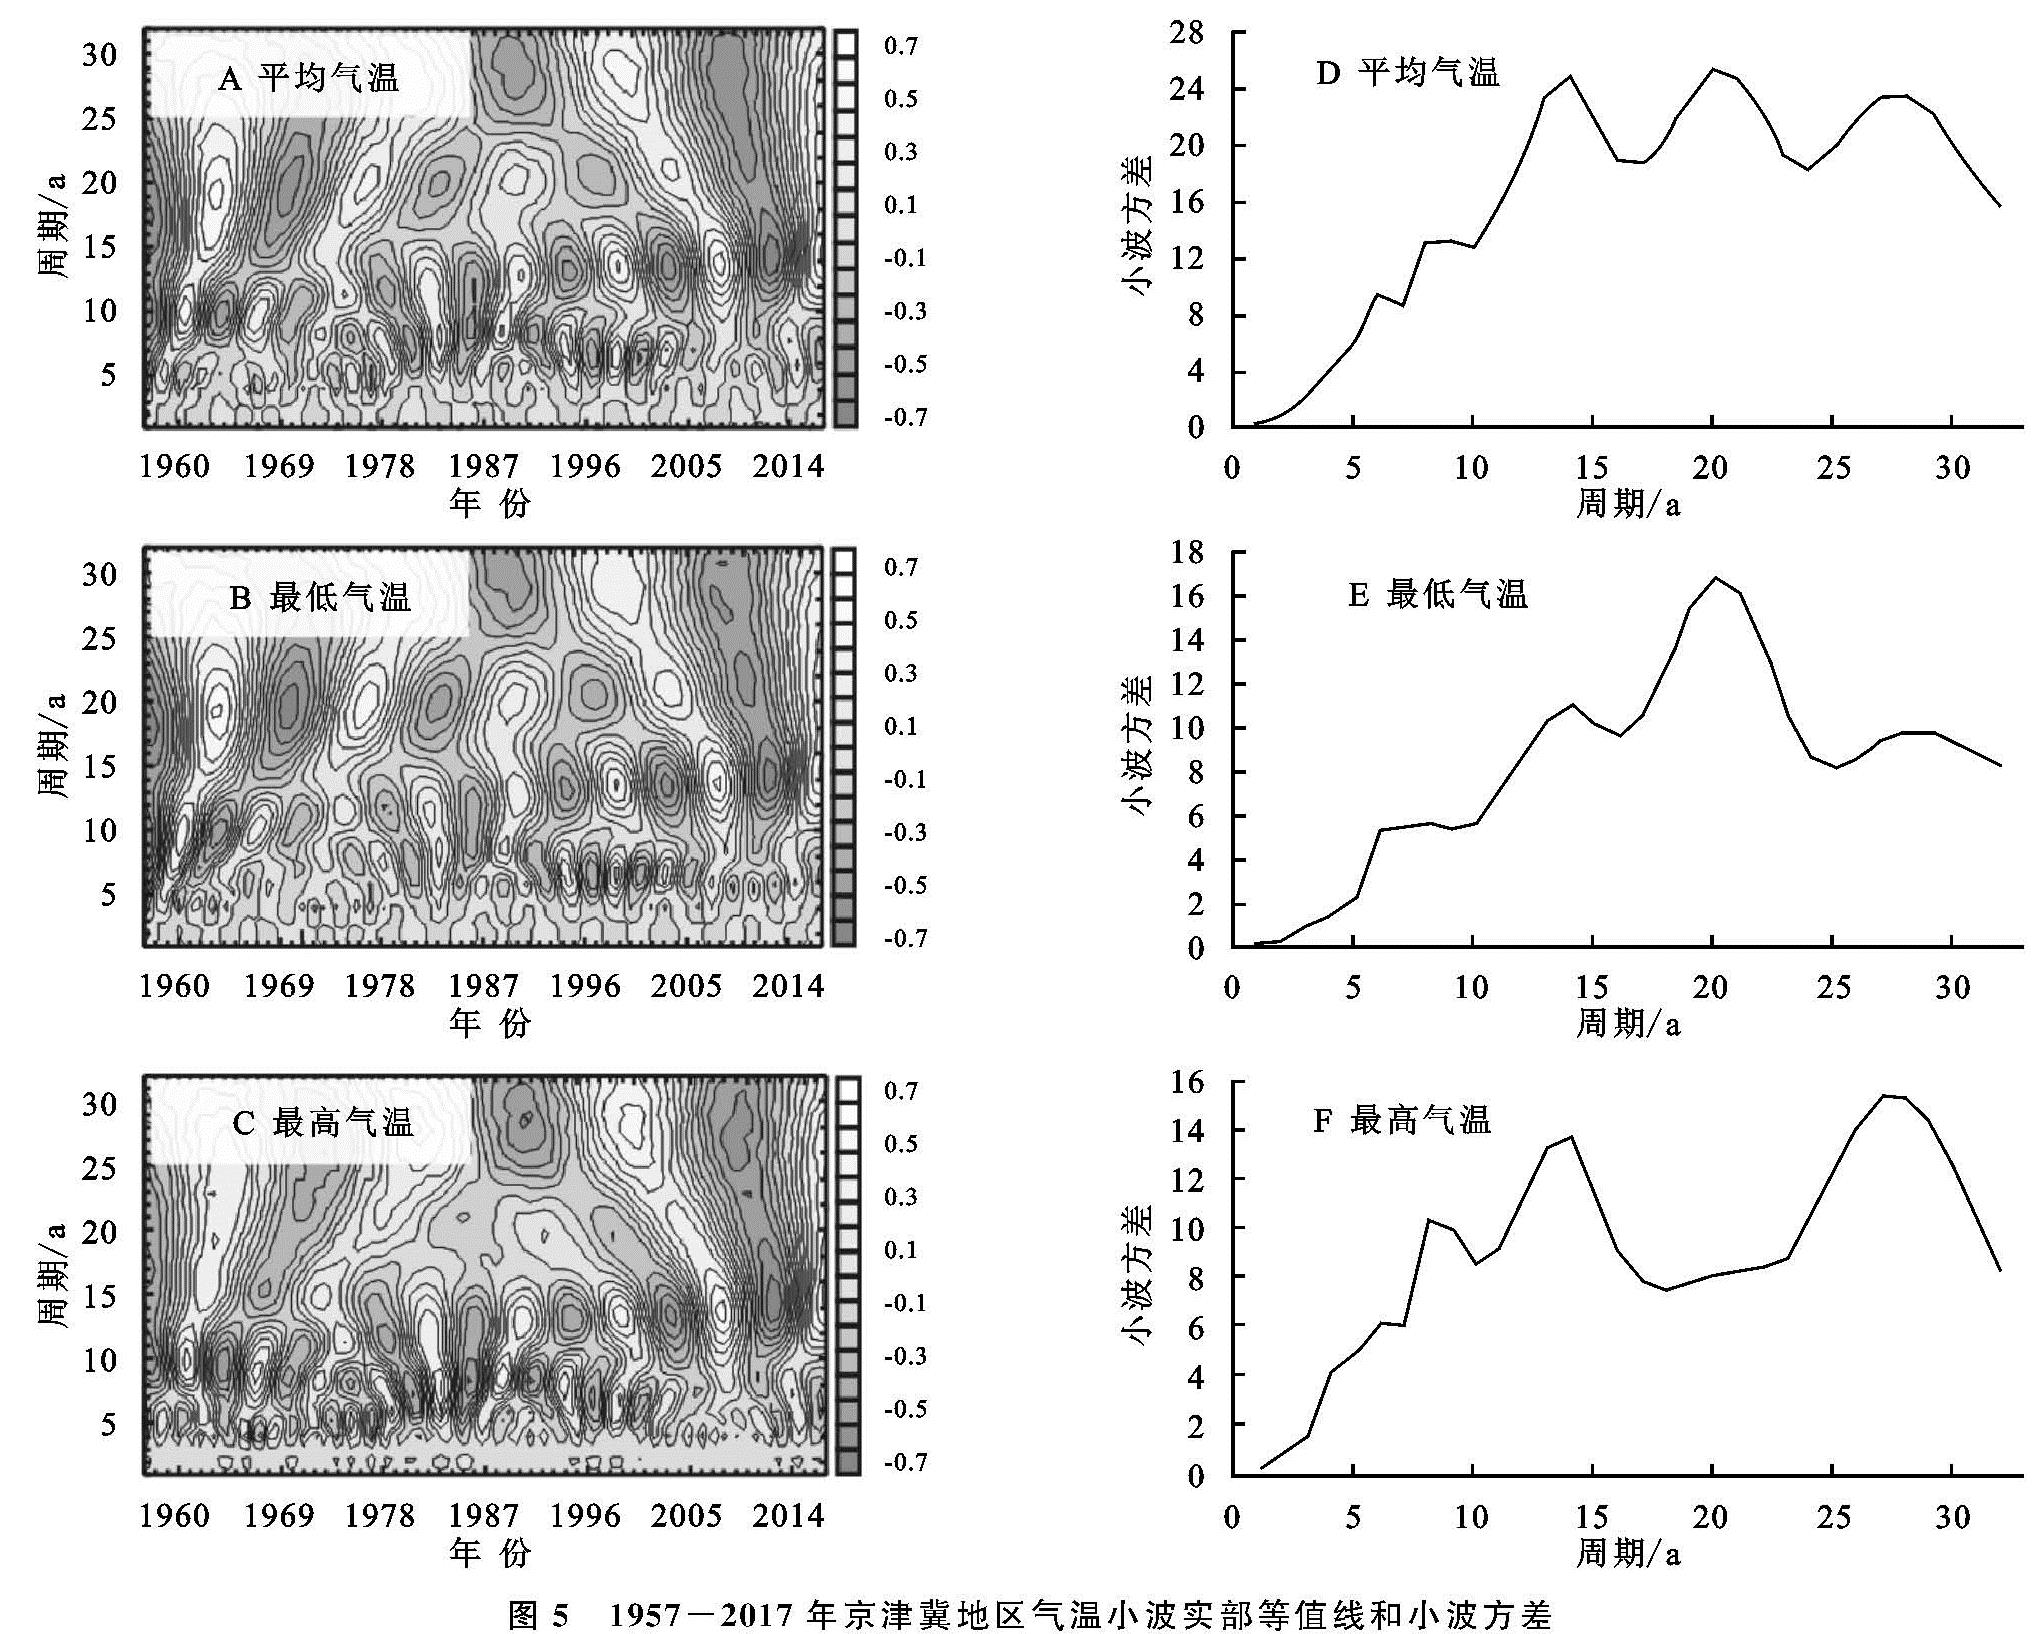
近61 a来,京津冀地区气温的相位变化周期具有多尺度、多层次的结构特征。其年际尺度周期不具全时域性:3类气温均存在6 a左右的振荡周期,但该周期仅在20世纪70年代至20世纪初较明显(图5); 平均气温和最高气温还存在8 a左右的振荡周期,该周期逐渐转向高频(14 a)。气温变化的年代际尺度周期冷暖交替较清晰:平均气温和最低气温均以20 a为第一主周期,该周期在小波方差图中峰值最明显,在小波等值线图中振荡较强烈,并具全时域性,气温在该尺度上经历了近5组的“负—正”相位(对应“冷—暖”)交替变化; 第二、三主周期均分别为14,28 a。最高气温以28 a为第一主周期,经历了近4组“冷—暖”交替变化; 第二主周期为14 a。14 a周期均由8 a左右周期转变形成,振荡强度逐渐增加。四季气温的显著相位变化均为年代际尺度,3类气温振荡周期较一致,春、夏、秋、冬季分别以27,26,14,21 a为第一主周期(图略)。
本区气温的小波等值线均未闭合,在年代际、年际尺度上分别处于负、正相位,可推测本区未来较长时间仍将处于偏暖期,而近两年则处于偏暖期的相对较冷阶段。本区气温在28 a周期上振荡强烈、清晰,但本研究时长为61 a,因而该尺度周期有待于更长时间序列的进一步证实。
图5 1957-2017年京津冀地区气温小波实部等值线和小波方差
2.4 气温时空变化空间格局
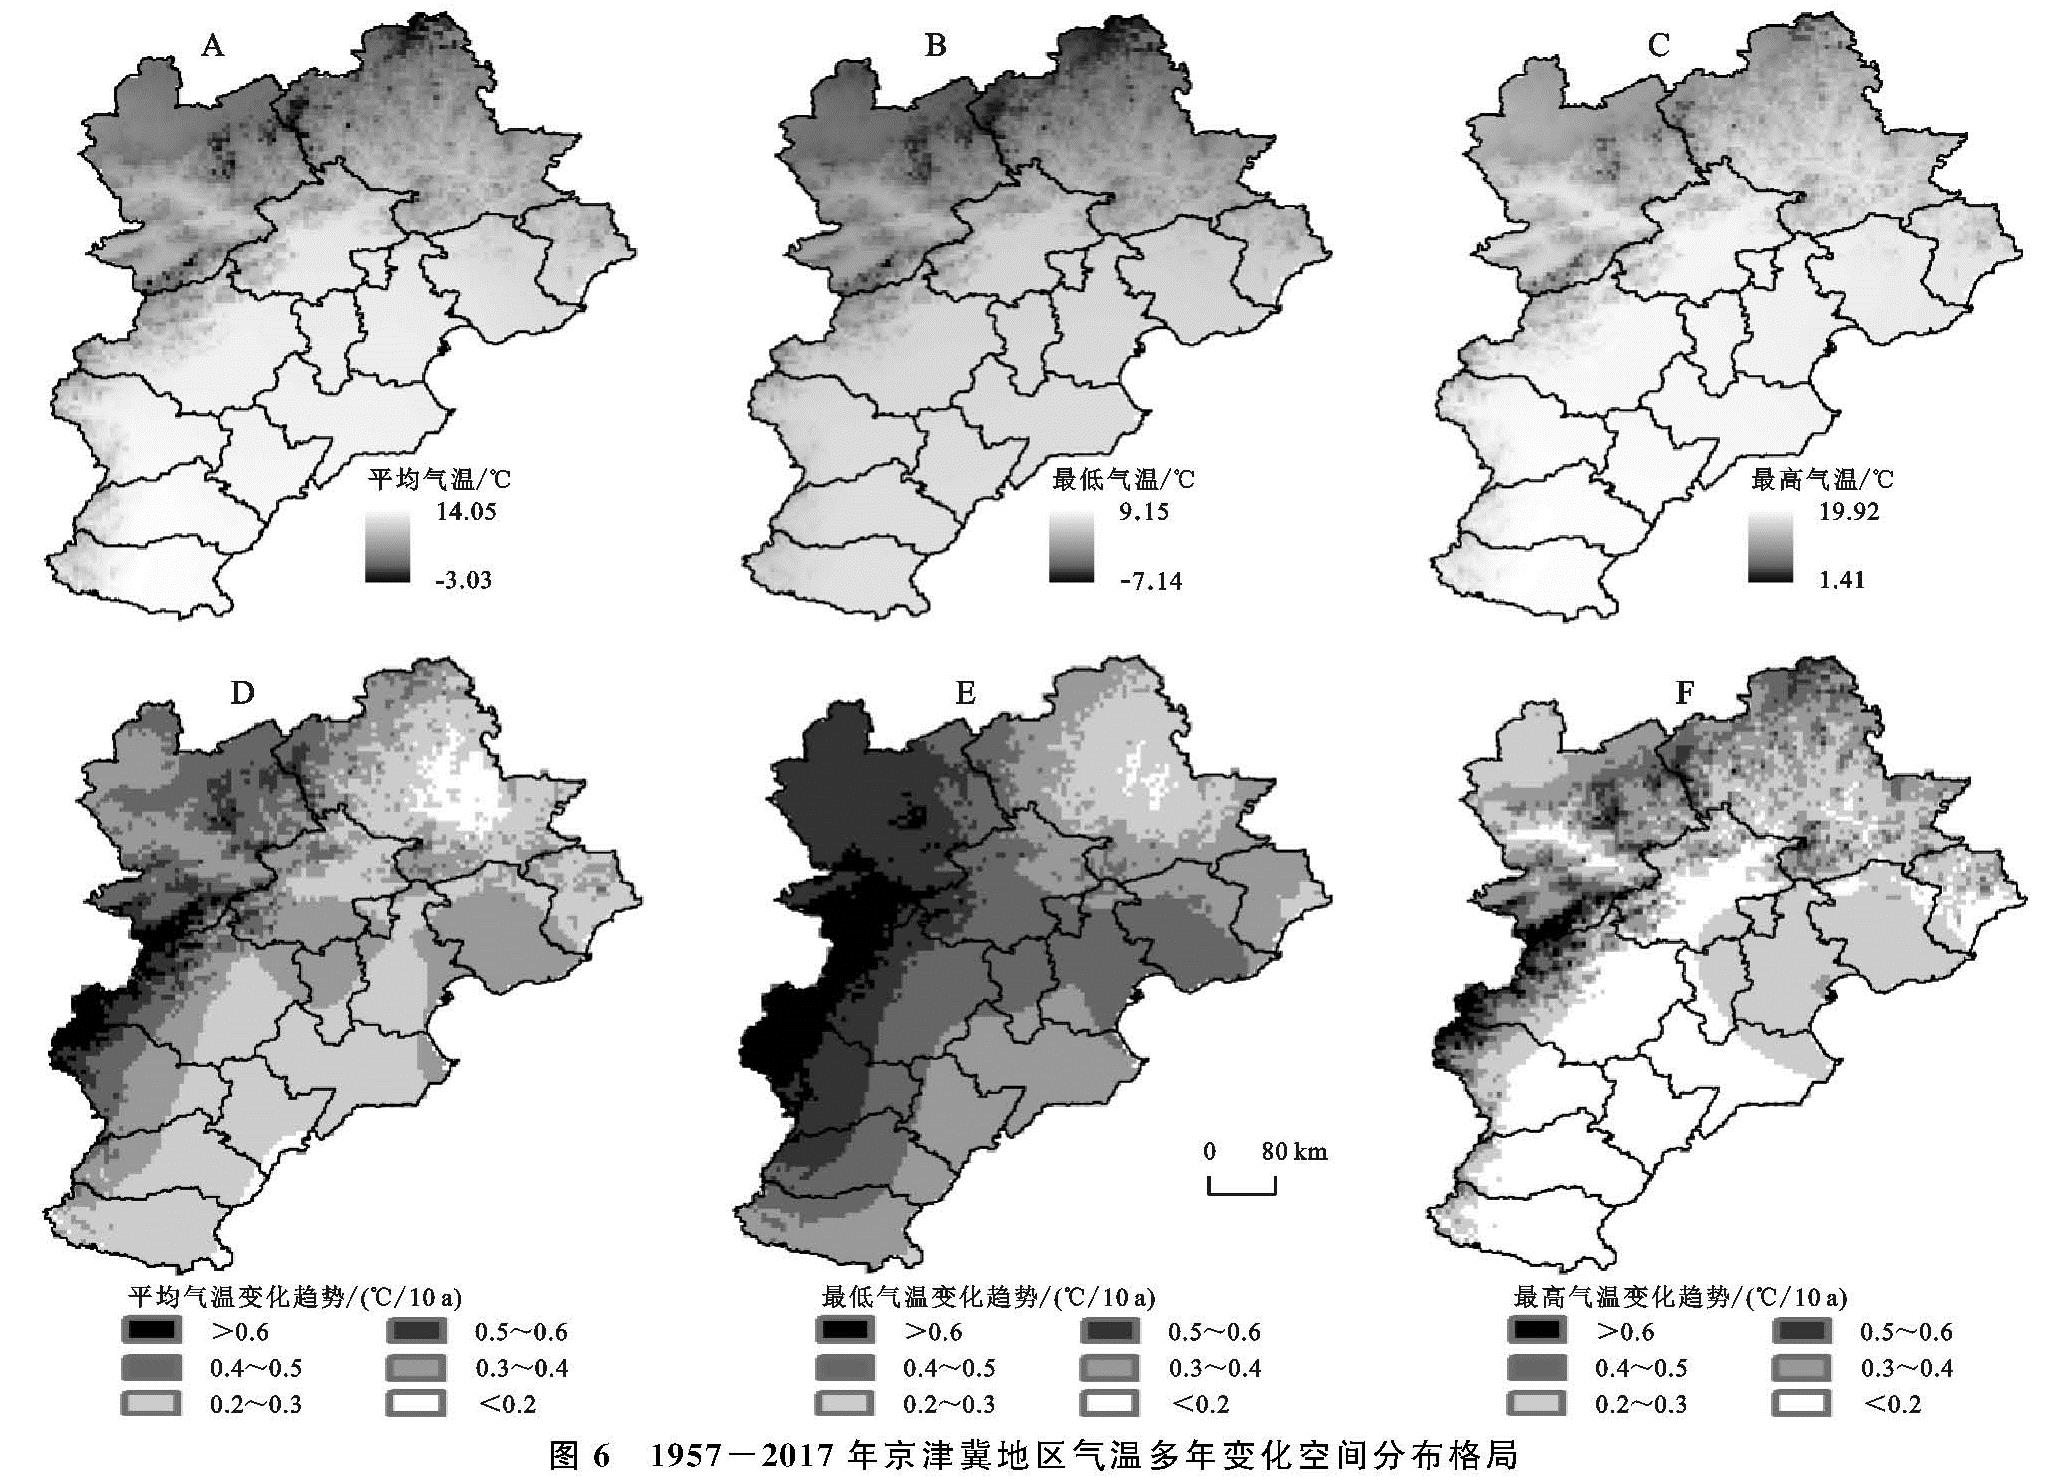
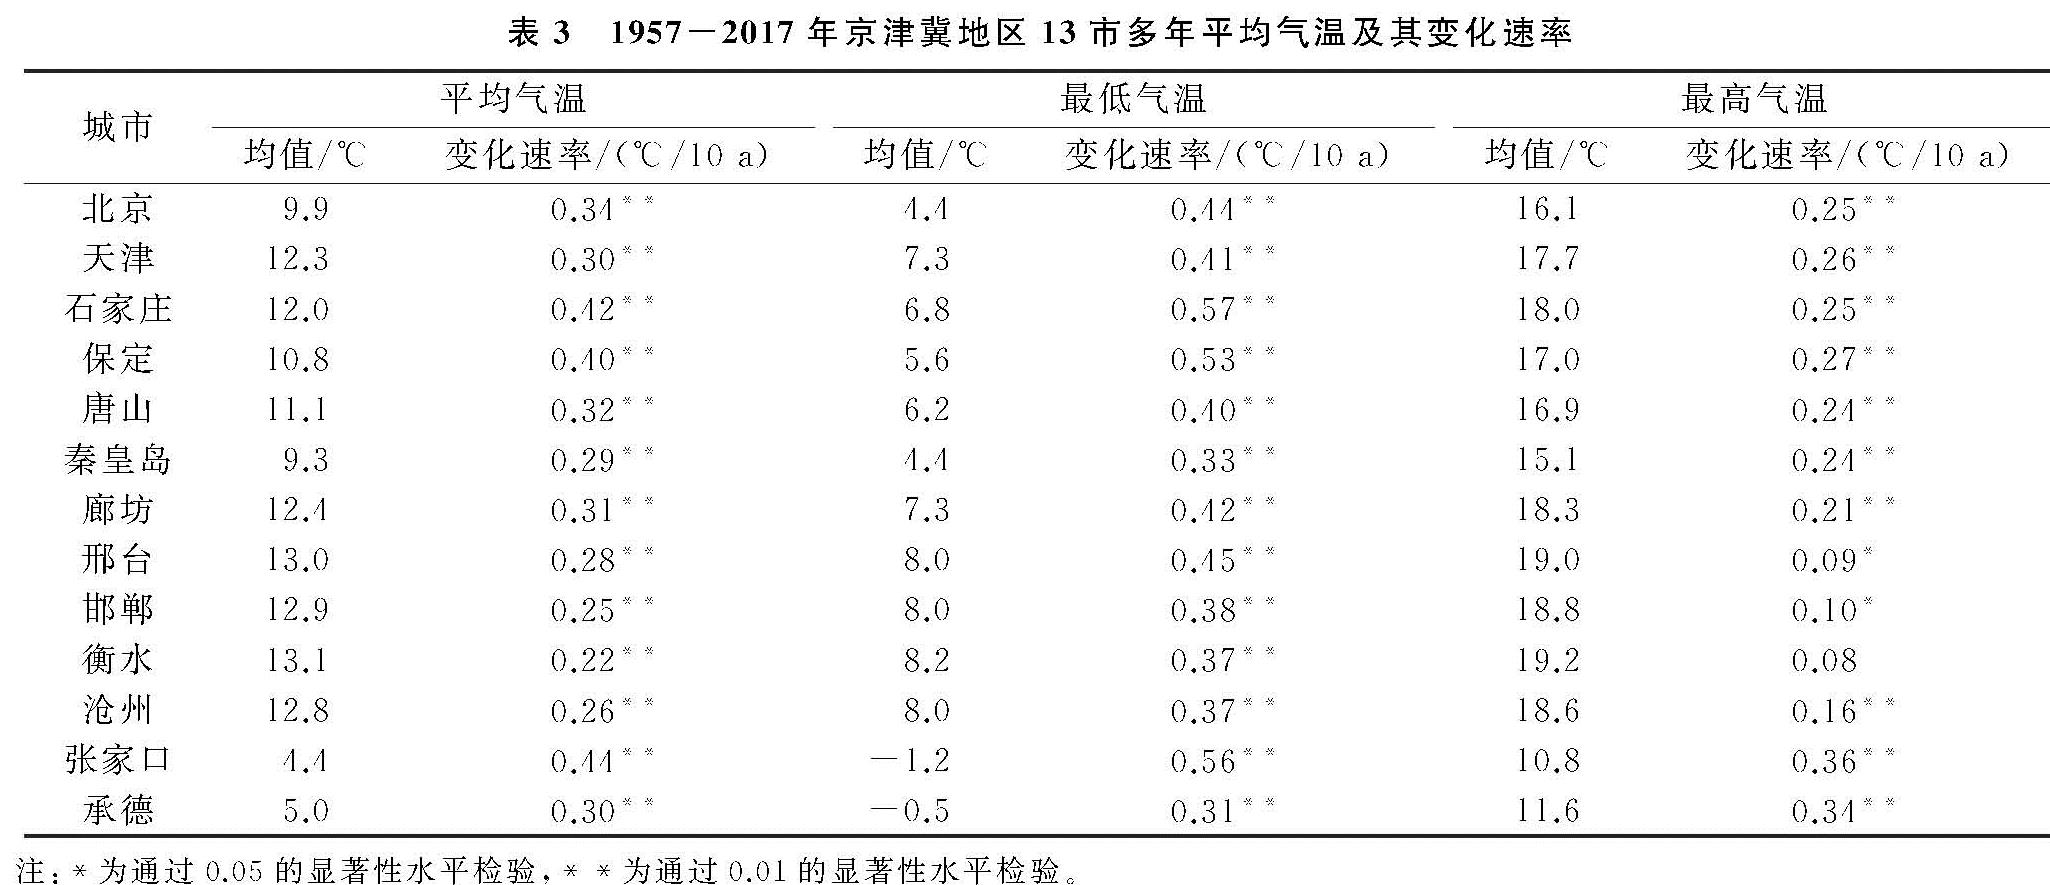
京津冀地区近61 a平均气温、最低气温和最高气温的空间分布均呈现自东南向西北逐渐降低的趋势(图6A—C),且内陆地区气温高于沿海,平原地区气温高于山区、丘陵。3类气温的最高值均出现在河北省南端的太行山中段东麓,最低值出现在冀北高原区的围场和张北地区。最高气温极值相差最大(18.5 ℃)、平均气温次之(17.1 ℃)、最低气温最小(16.2 ℃)。京津冀地区13市中,衡水气温最高、其次为邯郸,张家口气温最低、其次为承德(表3)。四季气温空间分布格局与全年相似(图略),并同样以最高气温的空间极值相差最大(春季21.5℃、夏季20.7℃、秋季20.4℃、冬季19.3℃)。
1957—2017年,京津冀地区3类气温均呈上升趋势(图6D—F),升温速率呈现随海拔升高而增加的特点。同时,在海拔较低,人口、工业相对集聚的北京、天津及唐山等地区升温较快,出现城市热岛“升温加速带”,最终形成升温率东、西高,南、北低的空间格局。本区全年最低气温升温率普遍较高,57.8%的区域全年最低气温升温率超过0.4 ℃/10 a; 平均气温次之,73.4%的区域升温率集中在0.20~0.40 ℃/10 a。最低气温及平均气温升温率在区域中西部的太行山北段最高,在东北部植被覆盖度较高的燕山丘陵区最低。最高气温升温率普遍相对较低,本区中心及南部山前平原区约67.6%的区域升温率低于0.3 ℃/10 a,这部分气温变化多不显著。行政区划上,张家口平均气温、最高气温,以及石家庄最低气温升温率居13市之首; 衡水平均气温、承德及邢台最低气温上升最为缓慢(表3)。四季气温变化率空间分布规律与全年较一致(图略),冬季平均气温、最低气温升温率普遍较高,分别约51.0%,97.5%的区域升温率高于0.50 ℃/10 a; 最高气温则在春季升温率相对较高,51.9%的区域升温率处于0.3~0.5 ℃/10 a。
2.5 气温变化持续性
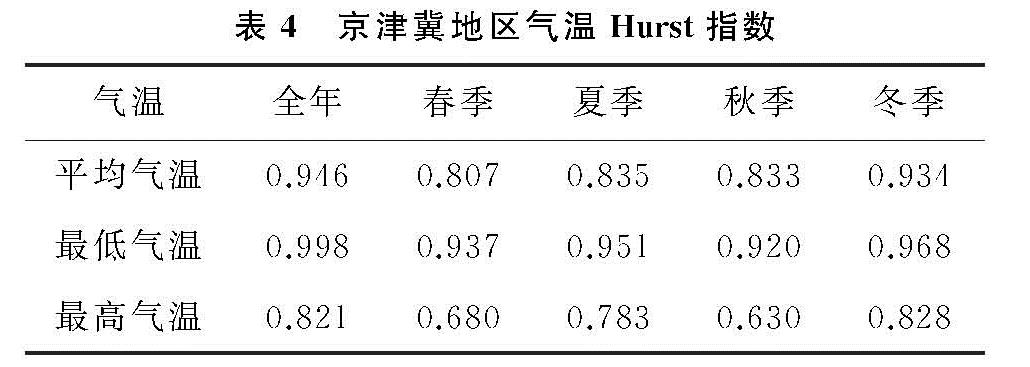
京津冀地区全年及四季的平均气温、最低气温及最高气温均呈现出明显的Hurst现象,说明本区气温变化含有较强的趋势性成分,其时间序列具有长程相关性。3类气温H值均>0.5(表4),其未来变化趋势将与过去变化一致,即持续升温。其中,全年及四季最低气温的H值最高、均>0.9,平均气温次之,最高气温最低,未来升温趋势的持续性强度依次为最低气温>平均气温>最高气温。四季当中,冬季3类气温H值最高,该季节气温持续显著上升的可能性将高于其他季节。可见,低气温的升高仍是未来京津冀地区气候变暖的最主要力量。
图6 1957-2017年京津冀地区气温多年变化空间分布格局
表3 1957-2017年京津冀地区13市多年平均气温及其变化速率