2.1 时间变化特征
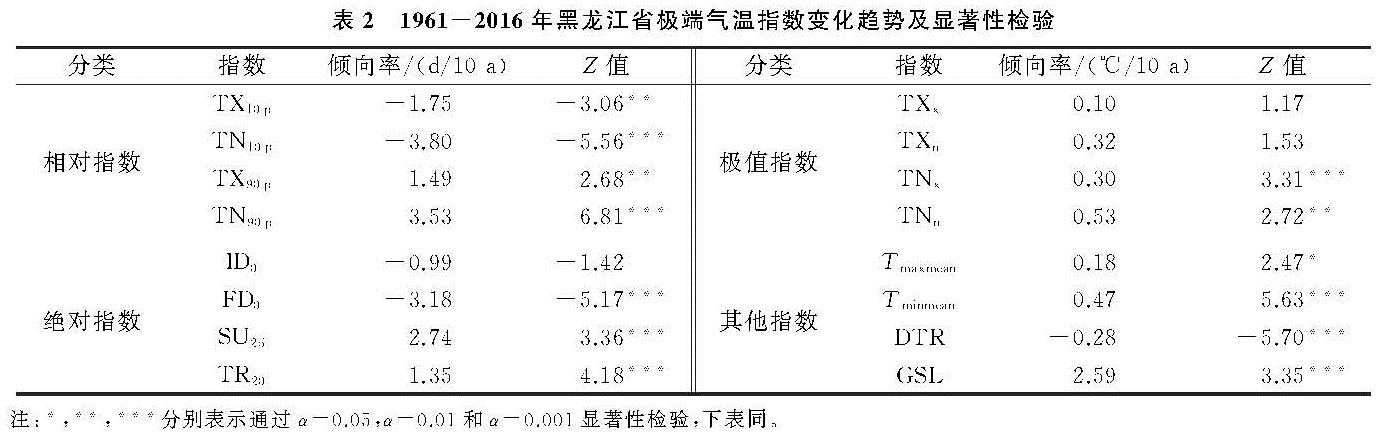
1961—2016年黑龙江省27个站点相对指数中,2个指数(TX10p和TN10p)呈降低趋势,2个指数(TX90p和TN90p)呈升高趋势; 绝对指数中,2个指数(ID0和FD0)呈降低趋势。2个指数(SU25和TR20)呈升高趋势; 所有极值指数均呈升高趋势; 其他指数除了DTR外,所有指数均呈升高趋势。
其中,FD0,TN10p和TN90p两个指数的变化趋势最显著,变化的速率分别为3.18,3.8,3.53 d/10 a; 13个指数(TX10p,TN10p,FD0,TNn,Tminmean,DTR,TX90p,TN90p,SU25,TR20,TNx,Tmaxmean和GSL)通过了α=0.05显著性检验(表2),表明极端气温指数有明显的升温趋势。
表2 1961-2016年黑龙江省极端气温指数变化趋势及显著性检验
综上所述,近56 a黑龙江省极端气温指数呈显著暖化趋势,且与日最低气温相关指数暖化趋势最显著(TN10p,FD0和TN90p)。
2.2 空间变化特征
2.2.1 相对指数
近56 a黑龙江27个站点的冷昼天数(TX10p)各站均呈减少趋势,减少幅度为0.4~3.4 d/10 a,瑷珲减幅最大(3.4 d/10 a),绥芬河减幅最小; 通过α=0.05显著性检验的地区主要分布在黑龙江省西北部以及中部大部分地区(图2A)。冷夜天数(TN10p)各站均呈减少趋势,减少幅度为0.6~6.0 d/10 a,孙吴减幅最大(6.0 d/10 a),漠河减幅最小; 除漠河站点外其余站点均通过了α=0.05的显著性检验(图2B)。暖昼天数(TX90p)各站点均呈增加趋势,增加幅度为0.2~3.6 d/10 a,漠河增幅最大(3.6 d/10 a),绥芬河增幅最小(0.2 d/10 a); 59.3%站点通过α=0.05显著性检验(图2C)。暖夜天数(TN90p)各站点均呈增加趋势,增加幅度为1.2~5.7 d/10 a,孙吴增幅最大(5.7 d/10 a),漠河增幅最小; 所有站点均通过了α=0.05显著性检验(图2D)。
2.2.2 绝对指数
就冰冻天数(ID0)而言,各站均呈减少趋势,减少幅度为0~2.2 d/10 a,呼玛减幅最大(2.2 d/10 a),富锦、绥芬河、铁力减幅最小; 11.1%站点通过了α=0.05显著性检验。(图3A)。霜冻天数(FD0)变化幅度为-6.7~0.6 d/10 a,漠河变幅为正值,其余变幅均为负值,孙吴减幅最大(6.7 d/10 a),漠河增幅最大; 除漠河站外其余站点。均通过了α=0.05显著性检验(图3B)。夏季天数(SU25)各站均呈增加趋势,增加幅度为0.3~4.6 d/10 a,呼玛增幅最大(4.6 d/10 a),绥芬河增幅最小; 除鸡西和绥芬河外,所有站点均通过了α=0.05显著性检验(图3C)。热夜天数(TR20)各站均呈增加趋势,增加幅度为0~4.0 d/10 a,齐齐哈尔的增幅最大(4.0 d/10 a),漠河、绥芬河、伊春增幅最小; 88.9%站点通过了α=0.05显著性检验(图3D)。
图2 1961-2016年黑龙江省极端气温相对指数变化趋势及显著性检验空间变化
图3 1961-2016年黑龙江省极端气温绝对指数变化趋势及显著性检验空间变化
2.2.3 极值指数
近56 a日最高温最大值(TXx)变化幅度为-0.1~0.5 d/10 a,3个站点变幅为负值,24个站点变幅为正值,嫩江增幅最大(0.5 d/10 a),漠河减幅最大(0.1 d/10 a); 14.8%站点通过了α=0.05显著性检验(图4A)。日最高温最小值(TXn)各站均呈增加趋势,增加幅度为0.1~1.3℃/10 a,漠河增幅最大(1.3℃/10 a),铁力增幅最小(图4B)。日最低温最大值(TNx)各站均呈增加趋势,增加幅度为0~0.7 d/10 a,孙吴增幅最大(0.7 d/10 a),漠河、通河增加幅度最小; 62.9%站点通过α=0.05显著性检验(图4C)。日最低温最小值(TNn)各站点均呈升高趋势,增加幅度为0.1~1.4℃/10 a,孙吴增幅最大(1.4℃/10 a),富锦增幅最小; 62.9%的站点通过α=0.05显著性检验(图4D)。
图4 1961-2016年黑龙江省极端气温极值指数变化趋势及显著性检验空间变化
2.2.4 其他指数
日最高温平均值(Tmaxmean)增加幅度为0~0.5 d/10 a,漠河增幅最大(0.5 d/10 a),绥芬河增幅最小; 70.4%站点通过了α=0.05显著性检验(图5A)。日最低温平均值(Tminmean)增加幅度为0.1~1.0℃/10 a,孙吴增幅最大(1.0℃/10 a),漠河增幅最小; 除漠河站外其余站点均通过了α=0.05显著性检验(图5B)。平均气温日较差(DTR)变化幅度为-0.7~0.3℃/10 a,漠河变幅为正值,其余站点变幅为负值,孙吴减幅最大(0.7℃/10 a),漠河增幅最大(0.3℃/10 a); 96.3%站点通过α=0.05显著性检验(图5C)。生物生长季(GSL)增加幅度为0.8~3.9 d/10 a,牡丹江增幅最大(3.9 d/10 a),虎林增幅最小; 88.9%站点通过了α=0.05显著性检验(图5D)。
综上所述,冷昼天数(TX10p)、冷夜天数(TN10p)、冰冻天数(ID0)各站点均呈减少趋势; 暖昼天数(TX90p)、暖夜天数(TN90p)、夏季天数(SU25)、热夜天数(TR20)、日最高温最小值(TXn)、日最低温最大值(TNx)、日最低温最小值(TNn)、日最高温平均值(Tmaxmean)、日最低温平均值(Tminmean)、生物生长季(GSL)各站点均呈增加趋势。表明在空间分布方面,近56 a黑龙江27个站点极端气温指数均呈暖化趋势,其中,暖化趋势最为显著的是漠河、孙吴等地。
在世界变暖这个大背景下,全国各地都表现不同程度的暖化,另外,黑龙江是国家重要的能源工业基地,是主要的煤炭调出省之一,而黑龙江相比于全国来说温度相对较低,冬季人们大量烧煤取暖,产生温室气体,使得气温变得温暖。黑龙江省林业发达,但最近这些年树木数目呈下降趋势,同样加剧了气候变暖。黑龙江省森林面积减少同样导致全年日最高气温最高(低)值下降、最低气温最高值上升[29]。
图5 1961-2016年黑龙江省极端气温其他指数变化趋势及显著性检验空间变化
2.3 突变分析
如图6所示,由Mann-Kendall突变检验可知,4个相对指数中,2个指数(TX10p,TN10p)分别在1992年、1986年发生减少突变,TN90p不存在突变点,TX90p于1987年发生增加突变; 对绝对指数而言,ID0不存在突变点,FD0在1988发生减少突变,SU25,TR20分别于1997年、1994年发生增加突变; 4个极值指数变化不大,2个指数(TXx,TXn)不存在突变点,2个指数(TNx,TNn)分别在1976年、1981年发生增加突变; 其他指数中,3个指数(Tmaxmean,Tminmean和GSL)分别于1988年、1985年、1987年发生增加突变,DTR在1986年发生减少突变。综上所述,大部分指数约在1980s中后期至1990s中期发生暖化突变。
图6 1961-2016年黑龙江省极端气温指数突变检验
2.4 极端气温小波分析
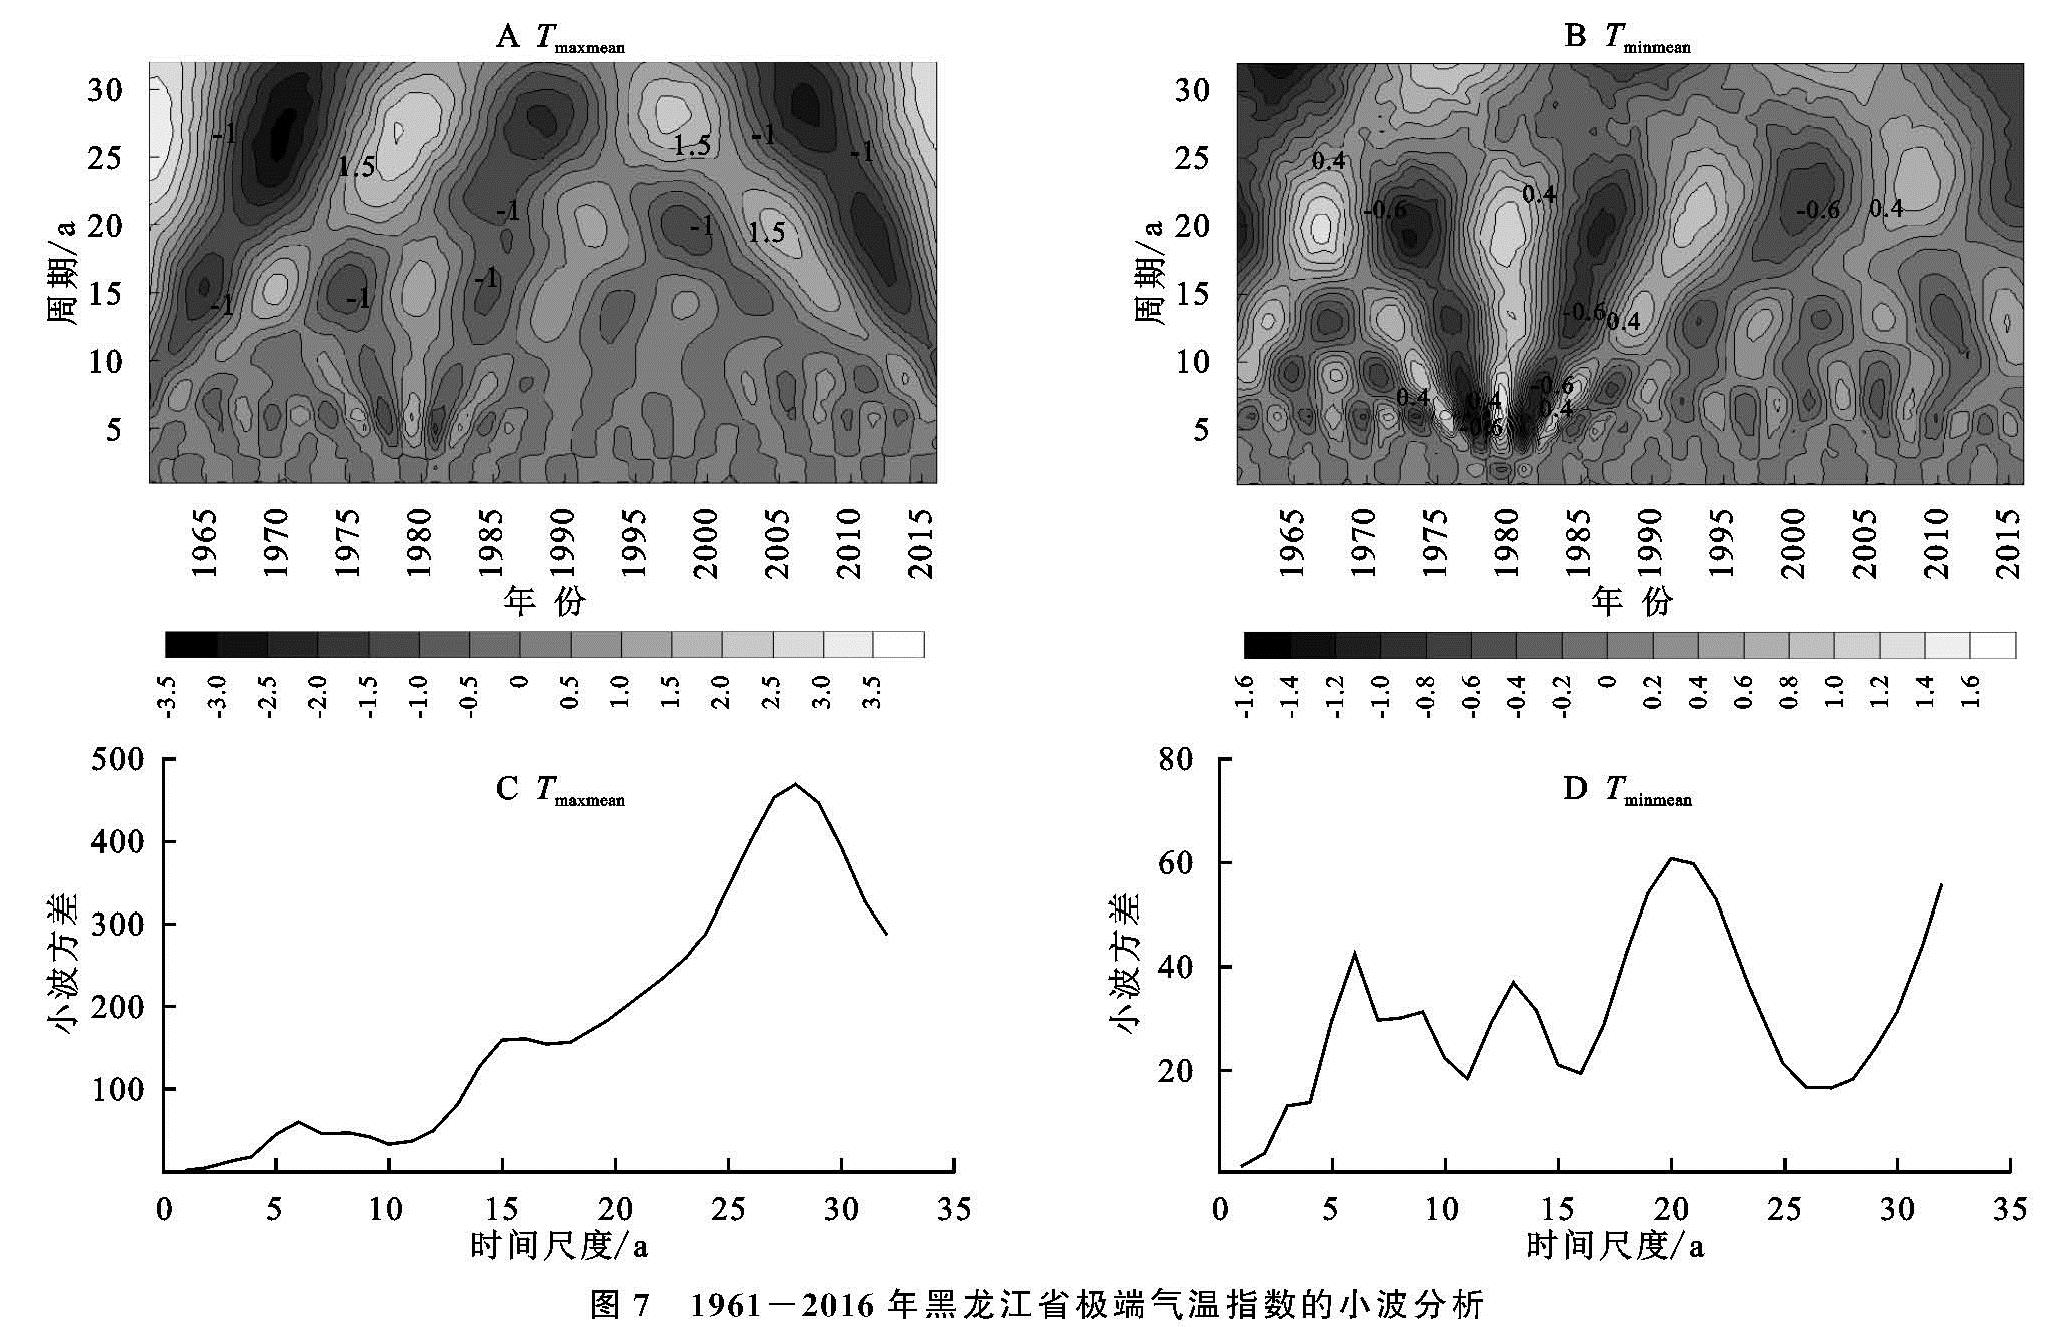
小波分析能够较好地揭示地学中时间序列降水和气温多种变化周期以及不同时间尺度中的变化趋势[30]。关于小波分析方法的介绍详见文献[26,31—32]。利用MATLAB对黑龙江省极端最高气温(日最高温平均值)和极端最低气温(日最低温平均值)进行了小波分析。从图7A可以看出,Tmaxmean大约存在4~8 a,13~18 a,25~30 a共3个尺度的周期变化,25~30 a震荡周期最为显著,其中主周期为27 a,日最高温平均值经历了高—低—高—低等7个循环交替,说明未来2~3 a日最高温平均值继续增加。Tminmean大约存在5~6 a,8~10 a,13~15 a,18~25 a共4个尺度的周期变化,18~25 a震荡周期最为显著,其中主周期为20 a,日最低温平均值经历了高—低—高—低等9个循环交替。
图7 1961-2016年黑龙江省极端气温指数的小波分析
2.5 极端气温指数变化趋势与海拔高度、经纬度的关系
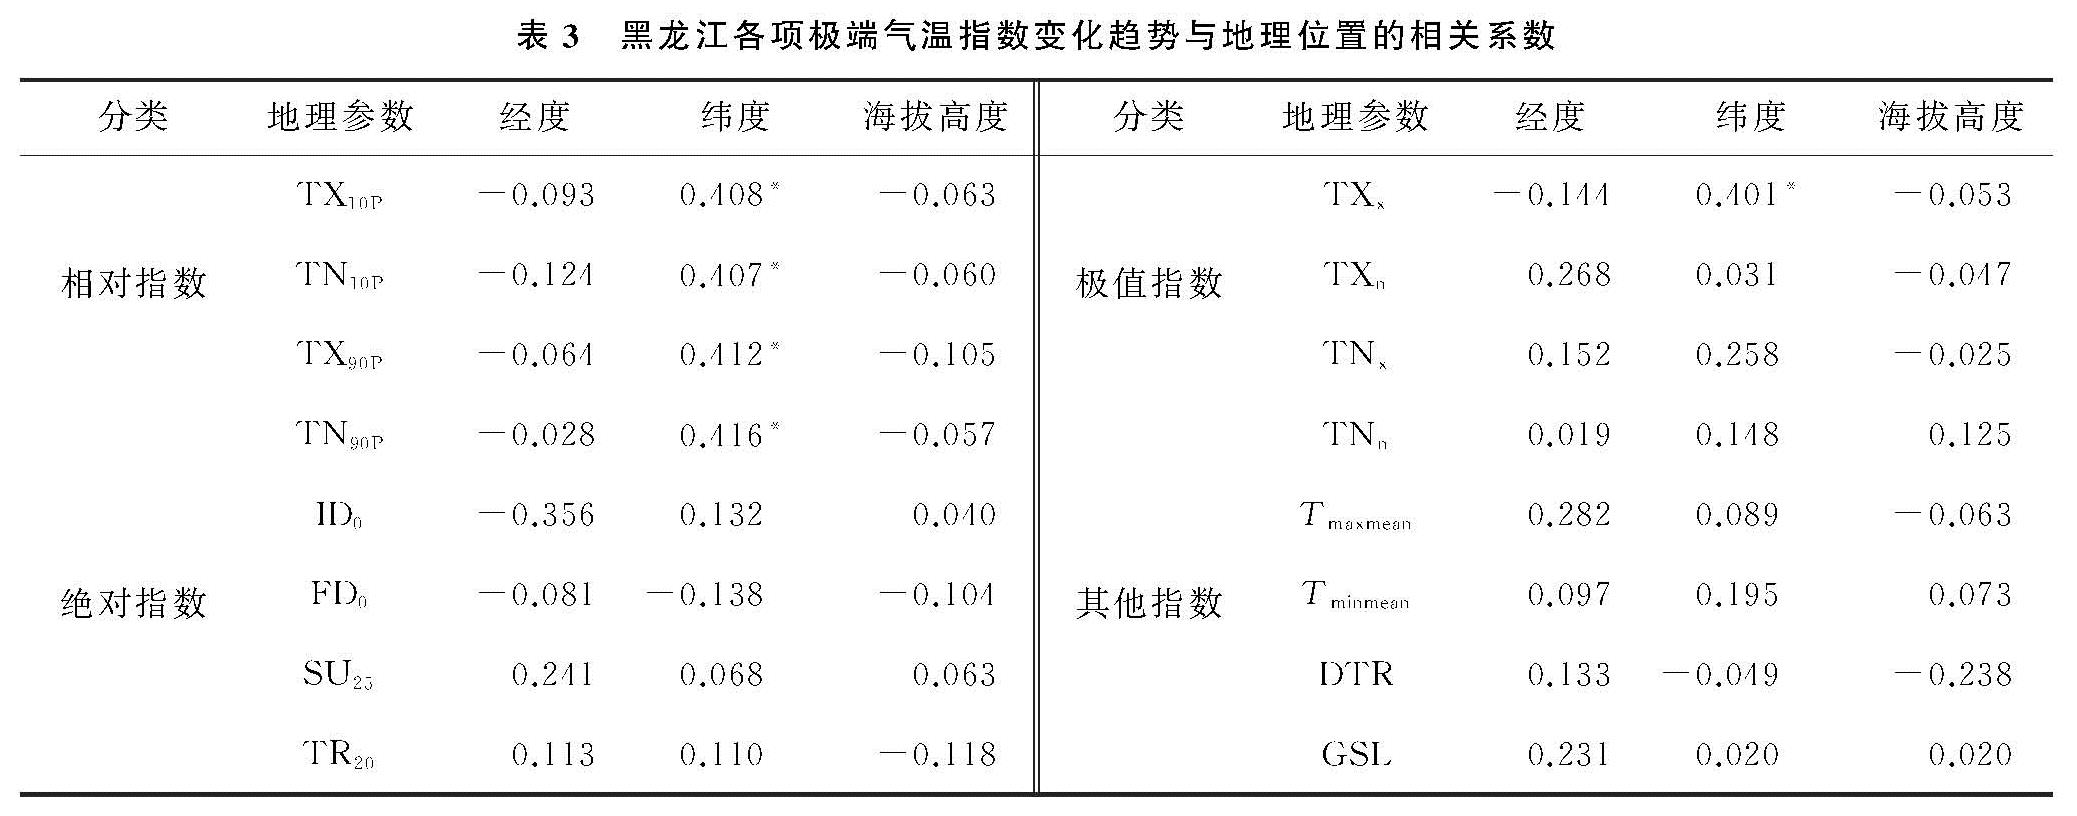
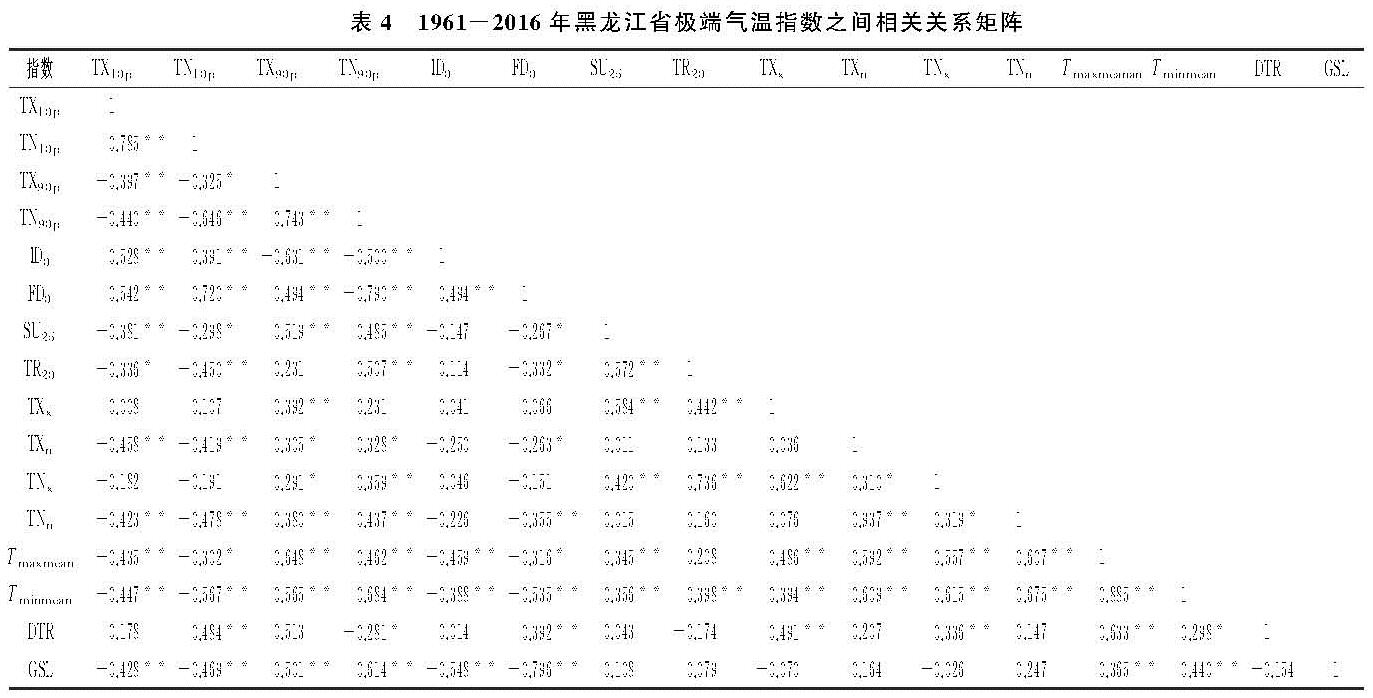
根据各项极端气温指数变化趋势与地理参数的线性相关分析来看(表3),相对指数与纬度的相关性普遍较高; 绝对指数和其他指数与纬度的相关性不明显; 极值指数中TXx与纬度的相关性较高。可能是由于黑龙江省跨纬度比较大所致。所有指数与经度和海拔高度的相关性不显著。另外,所有相对指数与极值指数中的TXx与纬度的相关性通过α=0.05显著性检验。指数与指数之间的相关关系见表4。
表3 黑龙江各项极端气温指数变化趋势与地理位置的相关系数
表4 1961-2016年黑龙江省极端气温指数之间相关关系矩阵
![表1 极端气温指数定义[21]](2020年02期/pic261.jpg)