2.1 气温时空变化分析
2.1.1 气温变化趋势分析
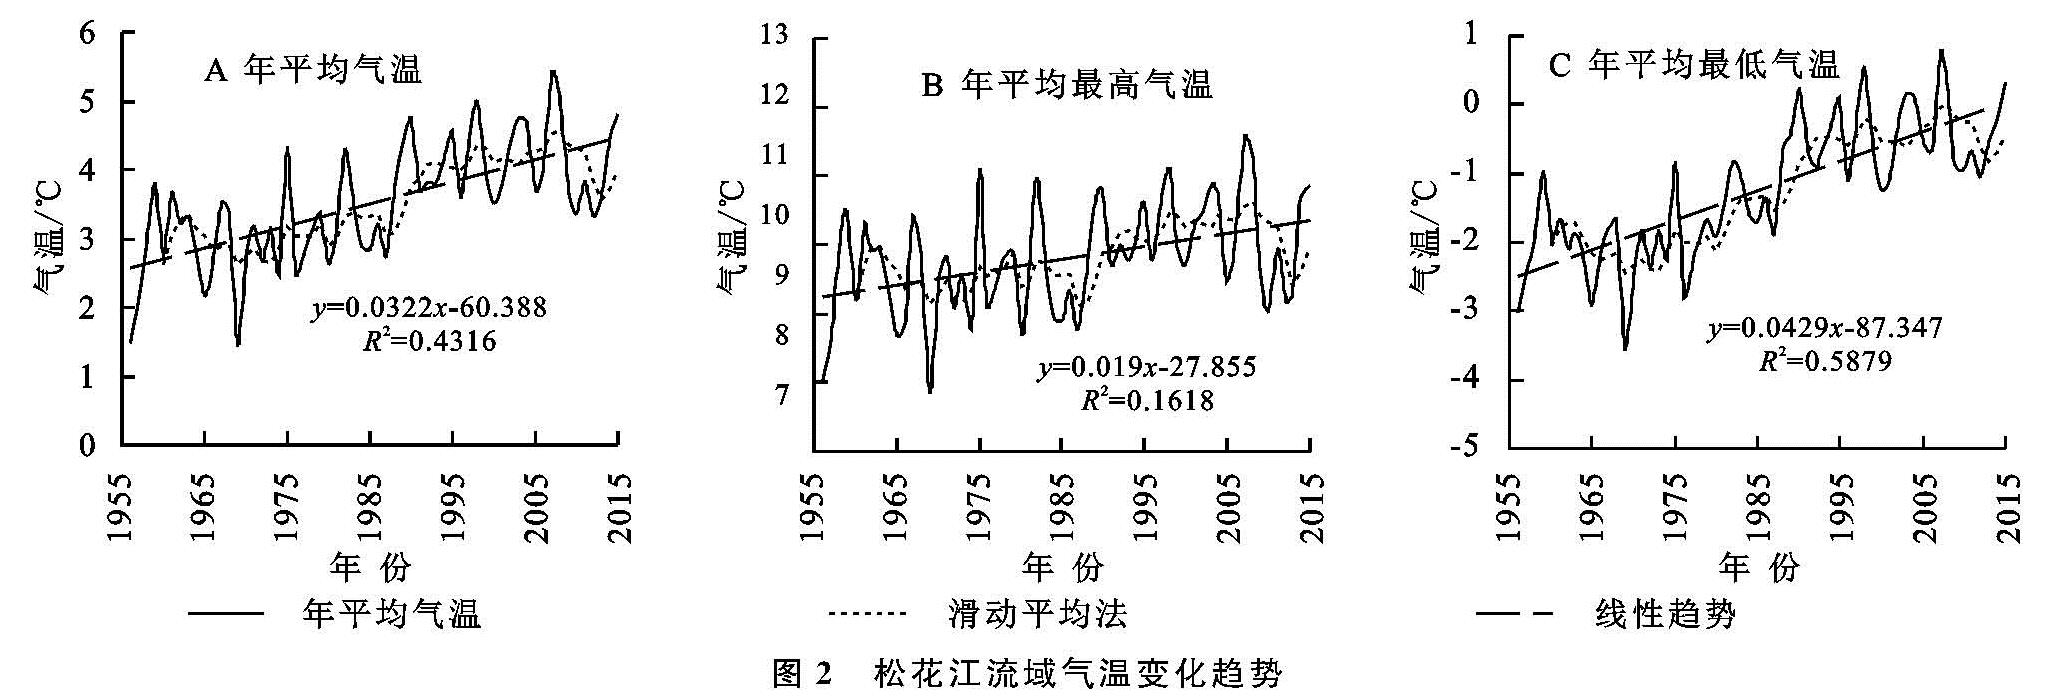
通过线性回归法和5 a滑动平均法对整个流域上的气温序列做趋势分析,分别得到年平均气温、年平均最高气温、年平均最低气温的变化趋势图,结果如图2所示; 对气温变化的趋势进行显著性水平为0.05的非参数统计检验,显著性检验结果见表1。
由线性趋势图可以看出,松花江流域上的3种气温序列均呈显著的波动上升趋势,其变化趋势也基本保持一致,但在增长率上存在一定的差异性。其中年平均最低气温的线性增长幅度最大,以0.429℃/10 a的幅值增长; 其次是年平均气温,为0.322℃/10 a; 年平均最高气温的线性增长幅度为0.19℃/10 a。这3种气温的增长趋势均通过了α=0.05的显著性检验,可认为增长是显著的。年平均气温上升程度处于同期全国增温范围内[5,15],0.322℃/10 a的增温略低于姜晓艳等[9]对东北地区气温变化的研究成果,与孙文等[11]对松花江流域最新气温研究的结果基本一致,同时年平均最低气温比最高气温增长更快也符合全国气温变化特征[5]。
从5 a滑动平均的结果来看,年平均气温和年平均最高气温的变化趋势较为一致,在20世纪50年代至80年代虽呈现波动上升趋势,但趋势较为平缓,相比而言,从20世纪90年代开始,气温的增长趋势更为显著,且气温的波动更为剧烈; 而对于年平均最低气温,气温序列从20世纪80年代开始即有较为剧烈的增长趋势,先于年平均气温和年平均最高气温。
2.1.2 气温空间变化规律
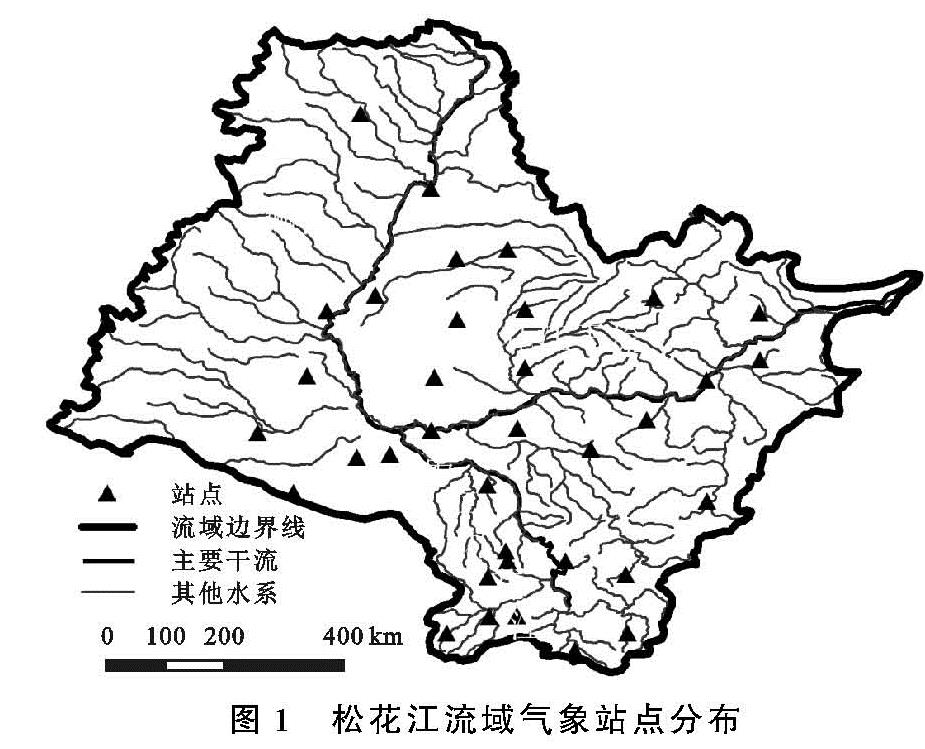
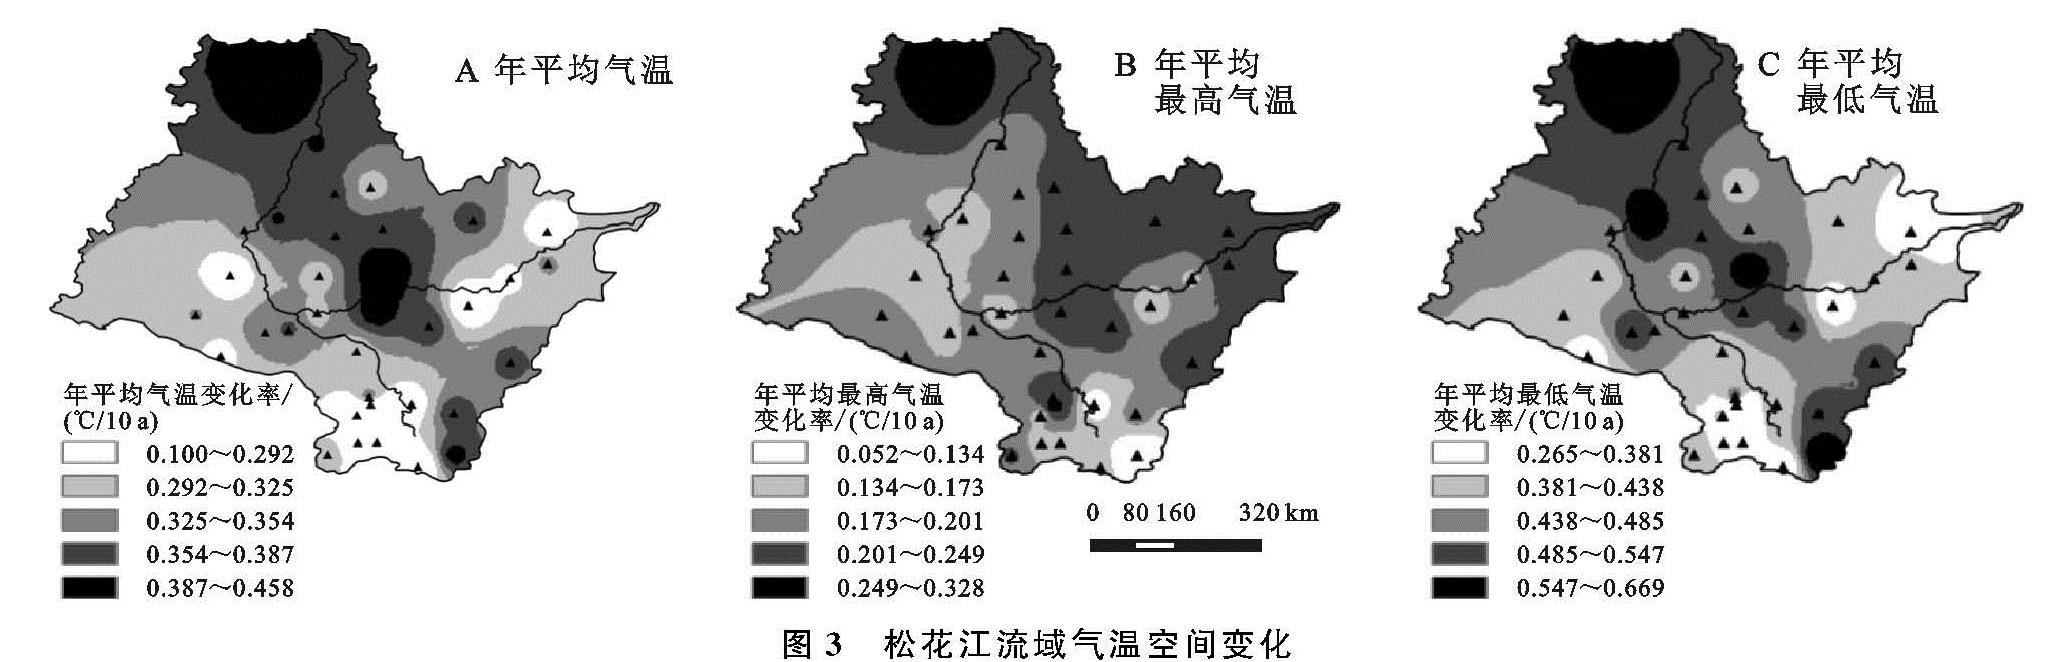
利用ArcGIS软件将各站点3种气温序列的变化趋势按照反距离加权平均(IDW)的插值方式绘制松花江流域气温变化的空间分布图(图3)。
从空间分布图中可以看出,在整个松花江流域上,3种气温序列的增长趋势大致相同。年平均气温上升范围在0.190~0.458℃/10 a; 年平均最高气温变化范围处于0.052~0.328℃/10 a,同比另外两种气温序列而言变化较为平缓; 年平均最低气温变化幅度非常剧烈,其上升范围在0.265~0.669℃/10 a,这可能是由于东北地区冬季呈现明显的暖干变化,从而导致年平均最低气温整体上升较快。
3种气温变化的空间分布都不均匀。且存在较为明显的高值区,其中嫩江流域的大兴安岭站、松花江干流的绥化站、黑龙江站的增长趋势最为显著,这些站点的3种气温均表现极高的增温趋势。整体上看,年平均气温和年平均最低气温的增长趋势具有非常高的相似性,且变化倾向率较高的站点基本分布在流域的西北—东南沿江条带上,在其两侧的气温增幅则稍弱; 而对于年平均最高气温来说,其变幅较大的区域在空间分布上整体向东北方向迁移。考虑到站点在松花江流域上的地理特征,气温变化的这种分布情况可能与区域自身的气候特征以及地理条件有关,另外也可能是受到靠近河流的地区城市化水平、土地利用率以及工业、农业发展的影响。
2.2 变异分析
用Mann-Kendall法对松花江流域1956—2015年年平均气温、年平均最高气温和年平均最低气温进行突变检验(取0.05的显著性水平),分别绘制正向序列UFk、反向序列UBk两条折线和显著性水平上、下信度线(U0.05=1.96),见图4。
M-K法用于突变检验时,当正向序列曲线超过信度线,即表示存在明显的变化趋势时,若正、反曲线的交叉点位于信度线之间,这点便是突变点的开始[16-17]。
由图4检验结果分析可得:3种气温的正向序列曲线UFk均超过了上信度线,即都显示出气温序列存在明显的正向变化趋势; 对于年平均气温和年平均最高气温,增温趋势在20世纪80年代后期非常显著,而年平均最低气温则在80年代前期就表现为明显的增长趋势,这与前面的趋势分析结果相符。
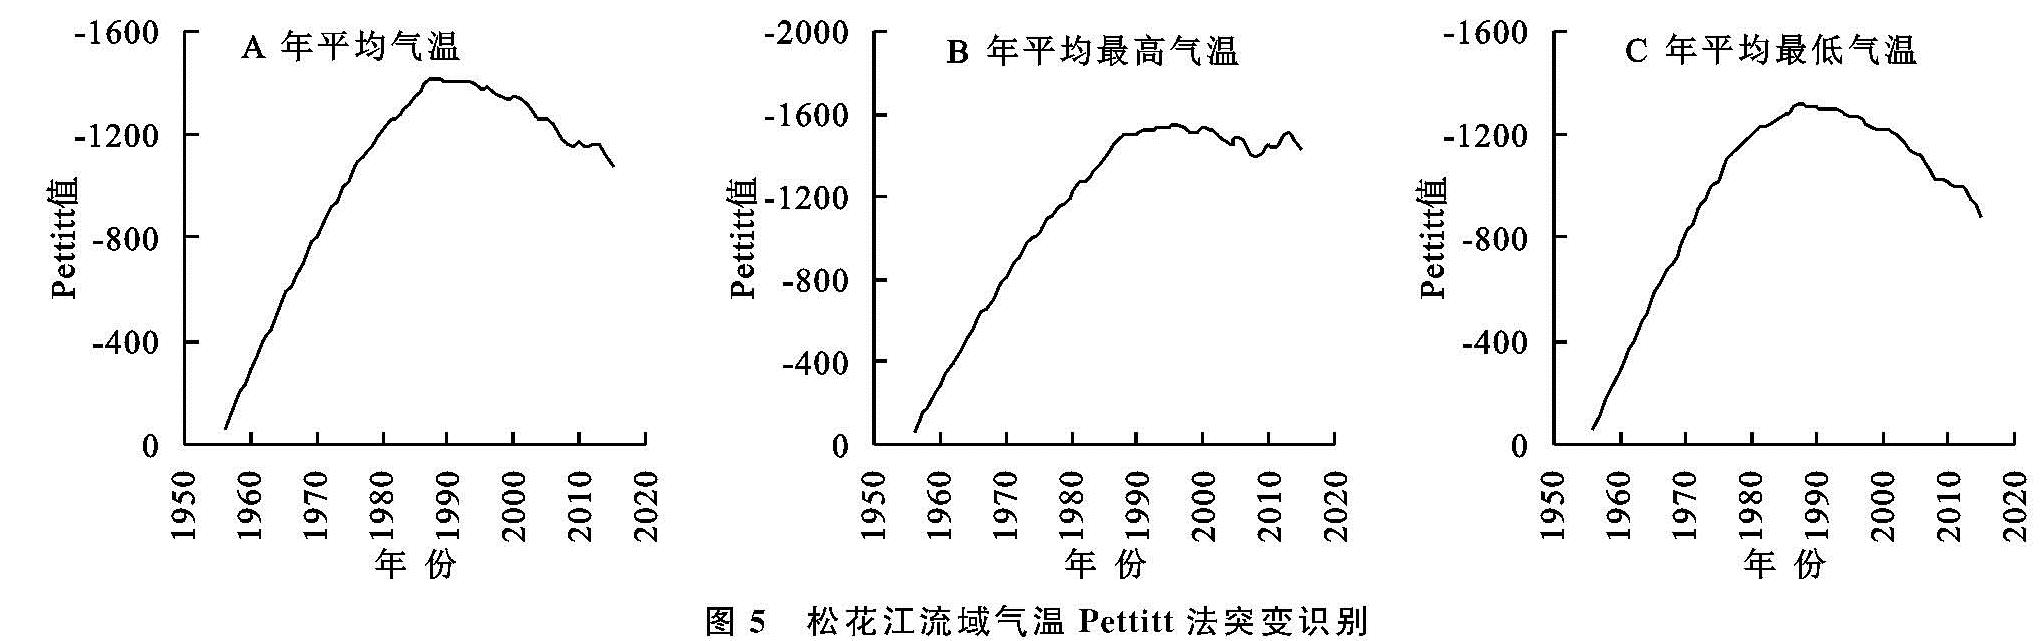
在上、下信度线内,3种气温的正、反序列曲线均存在交点。其中,年平均气温序列交点位于1989年左右,年平均最高气温序列交于1 992左右,年平均最低气温则落在1 987左右。在交点之后,3种气温均呈明显的增温趋势。为进一步验证其突变的可能性,结合Pettitt检验法对气温序列做突变检验,其结果如图5所示,对于年平均气温和年平均最低气温,其Pettitt最低值均只有一处,对应的年份分别为1988年,1987年,与M-K法识别结果基本一致; 而对于年平均最高气温,M-K法检验的突变年份1992年对应了一个低值,但其右侧仍存在较低值,从M-K检验图上可以看到,年平均气温在高于上信度线外,正、反序列曲线同样出现了交点,考虑到M-K法并不能肯定或排除其为该序列突变点的可能性,而Pettitt法不适用于多个突变点情况,可考虑该气温序列在其他点处依旧可能存在突变点的情况。结合两种突变识别的分析结果,可认为松花江流域的气温序列在1987—1992年之间存在突变。
图4 松花江流域气温Mann-Kendall法突变识别
2.3 周期分析
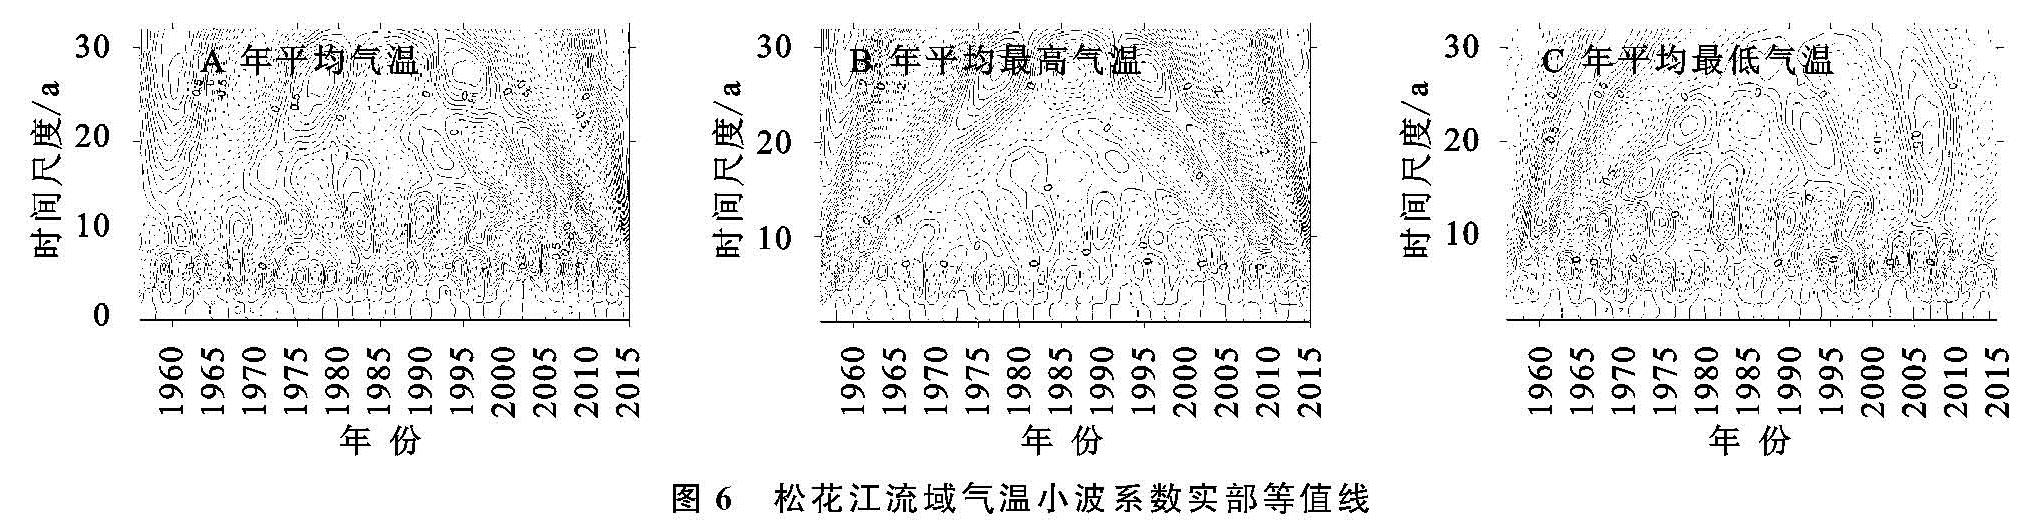
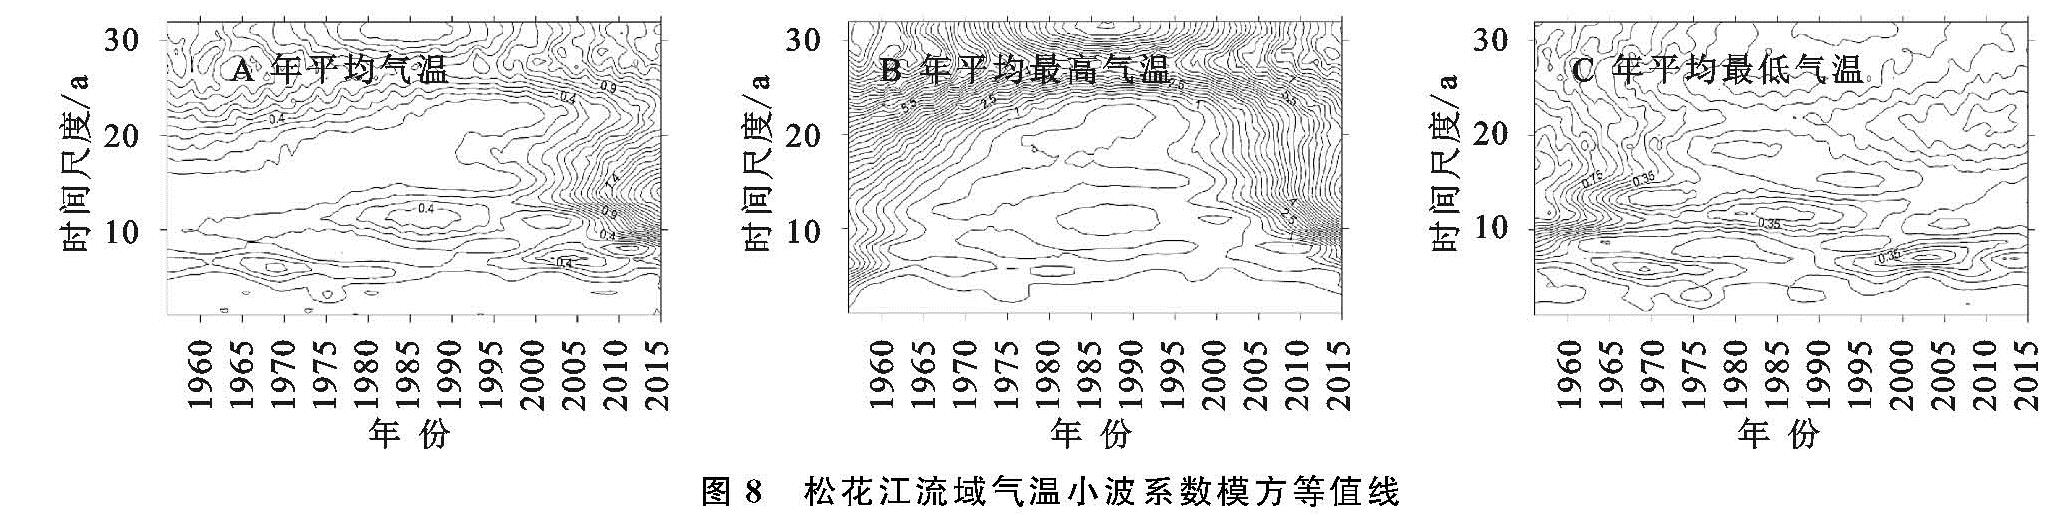
借助MATLAB的小波分析工具,得到小波系数,通过提取小波系数的实部部分后,利用克里金插值法绘制小波系数实部等值线图,见图6。对不同的时间尺度求取气温变化的小波方差值并绘制小波方差图,见图7。对小波系数的模取平方,同样利用克里金插值法绘制小波系数模方图,见图8。
小波系数实部等值线图能够反映在不同的时间尺度下序列的周期变化,同时能够体现不同周期在时间域上的分布情况,小波方差图能够表明不同时间尺度下时间序列波动能量的分布情况。因此可以利用实部等值线图和方差图分析气温系列的周期分布特征; 小波系数的模值显示了整个时间域上不同时间尺度下变化周期所对应的能量密度,因此小波系数模方图可用来分析对应尺度的周期性的显著性特征。
由图6和图7可以看出,3种气温序列的周期性特征较为类似,均存在3个明显的峰值,其时间尺度分别为28 a,14 a和7 a,其中28 a所对应的周期震荡最剧烈,可认为是气温变化的第一主周期; 14 a是峰值的次高点,其周期震荡较为明显,但弱于28 a所对应的周期,可认为是第二主周期; 第三主周期为7 a,从等值线图中可以明显得看出,该周期出现的次数最为频繁。流域在整个时间域内的气温变化周期基本是由以上3个周期波动控制。
由图8可知,3种气温序列中20~30 a时间尺度所对应的能量密度均最为集中,且贯穿于整个时间域内,说明该时间尺度内的变化周期最为明显,对整个研究时间域内的气温变化都起控制作用; 但在10~15 a和5~10 a时间尺度,能量密度的表现形式并不一致。对于年平均气温和年平均最高气温,10~15 a时间尺度的能量主要集中在1990年以后,而5~10 a时间尺度能量分布贯穿整个研究时间域; 年平均最低气温在10~15 a时间尺度上的能量密度集中在1990年之前,而5~10 a时间尺度的主要分布于1990年之后。这可能与气温序列在1987—1992年时间段内出现了突变有关,从而导致气温序列出现了新的周期性变化特征。