3.4.1 自然因子
研究区处于天山东部,山地平原植被垂直带完整,山地—荒漠—绿洲农业特点典型突出。阜康市气候条件独特,降水量、气温、地表温度等气象因子对该区域生态环境变化起着很重要作用。因此,本文选阜康市2000—2016年的平均气温、降水量、地表温度和平均相对湿度为主要自然因子分析气象因子变化及其生态环境的影响。从气候因素的变化规律来看,气温和地表温度的变化规律较相似,阜康市年平均气温及其气温距平如图3所示。在2000—2016年期间,阜康市年平均气温和地表温度的变化速率分别为1.39℃/16 a,1.73℃/16 a,其整体上升趋势非常明显,16 a的平均气温和地温为22.22℃,27.64℃。
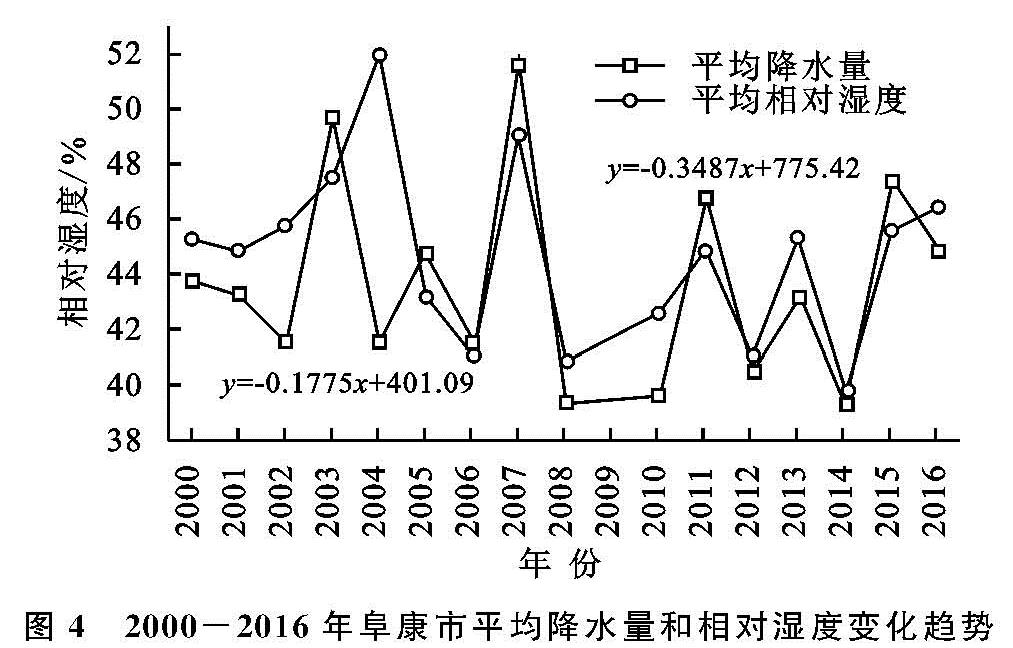
以2004年为界,阜康市年平均地温和气温经历了冷暖两个时期。2000—2004年虽然阜康市气温和地表温度呈现小幅度变化,但比2004年属于暖时期,2004年平均气温和地表温度降低到17.56℃,20.89℃。2008年阜康市平均气温和地表温度呈现最高值,分别上升1.37℃,2.17℃。而研究区降水量一直在不规则的波动性变化,平均降水量为75.26 mm。2003年、2007年和2015年间降水量呈现高值,最高值达到了139 mm。阜康市平均相对湿度的变化速率为2.79%/16 a,在2004年达到了最高值,51.93%; 从2004年起快速减少,在2014年呈现最小值39.79%。
图3 2000-2016年阜康市平均气温和地表温度变化趋势
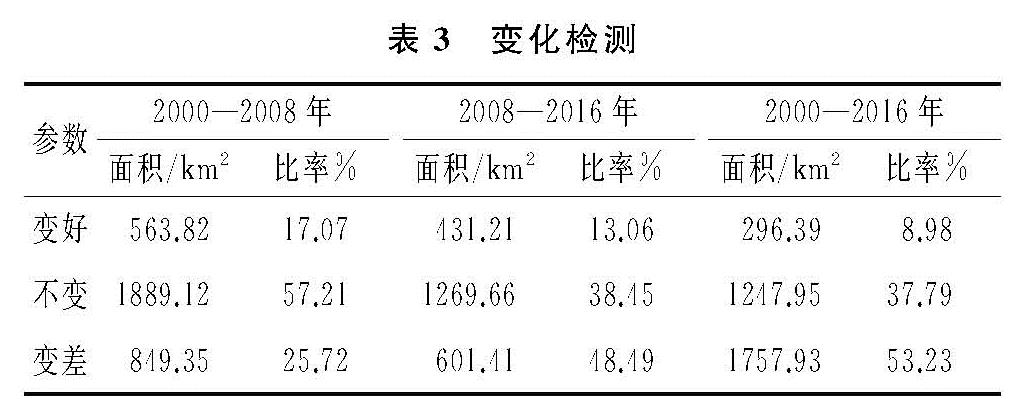
总的来讲,阜康市的气温和地表温度从2000—2016年趋于上升,而降水量和相对湿度呈现降低趋势(
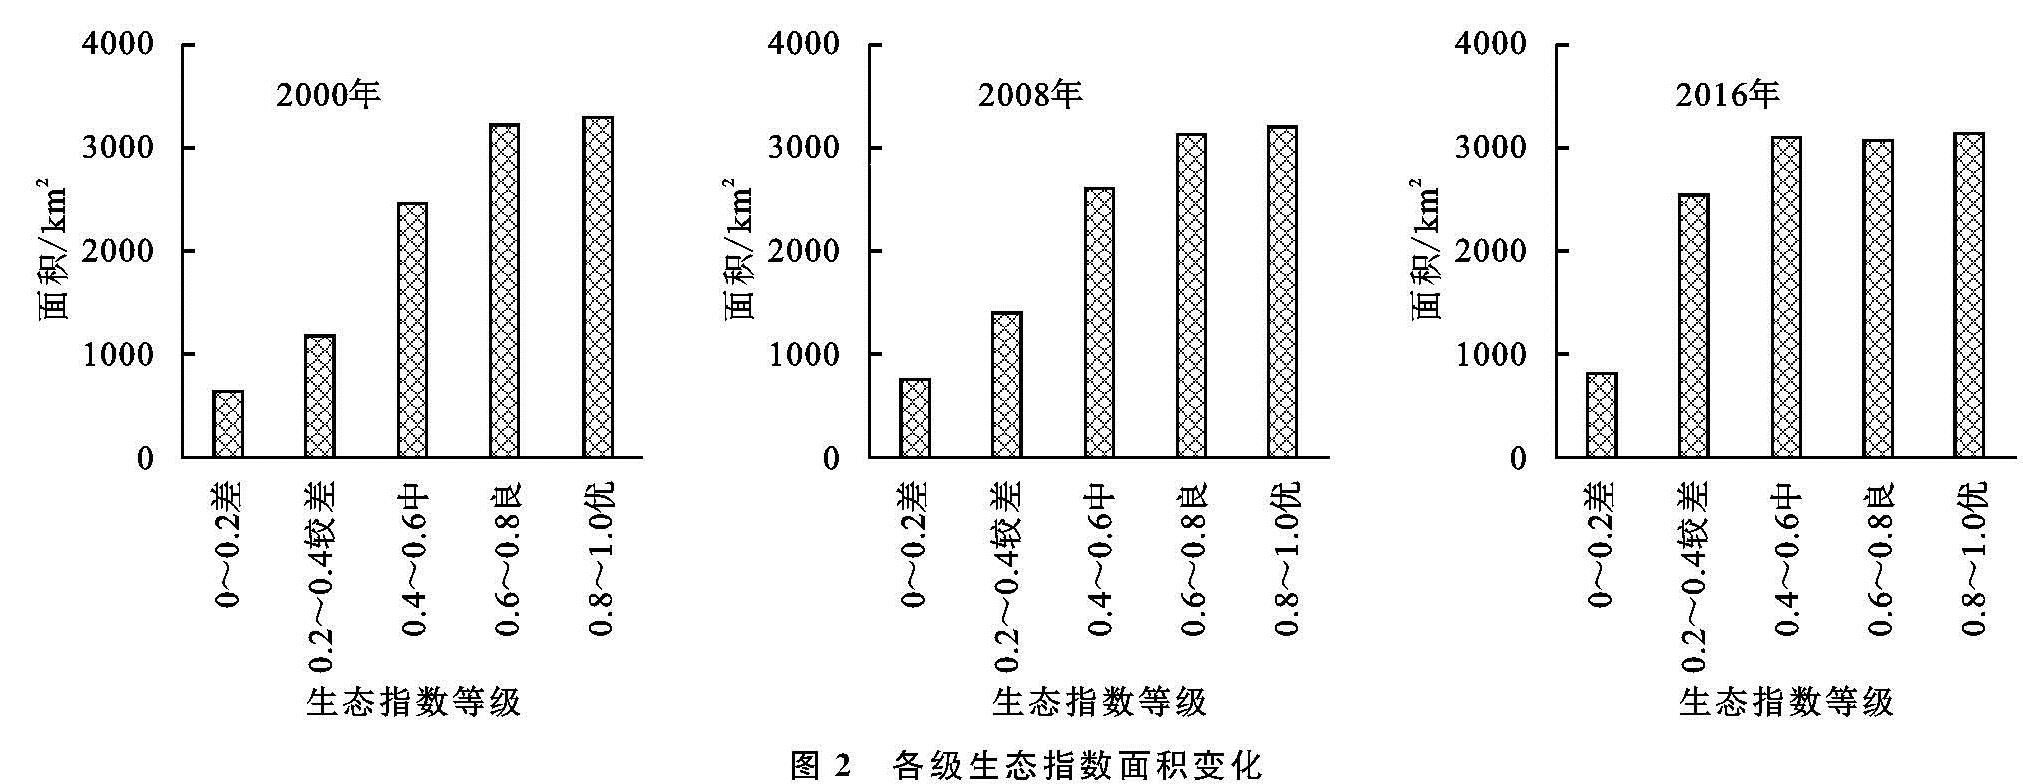
图4),这对研究区生态环境不利的情况,会导致旱灾,荒漠化。2000年、2008年和2016年的生态环境指数变化特征来看,2008年和2016年RSEI较差区域明显增长,主要分布草地、林地和耕地等土地利用类型分布带,同时2008年和2016年前后,研究区气温逐渐增加而降水量快速减少,干旱区植被一般对气候很敏感,这限制研究区植被正常生长,因此气候变化在一定程度上引起研究区生态环境的恶化的原因之一。
图4 2000-2016年阜康市平均降水量和相对湿度变化趋势
3.4.2 社会经济因子
2000—2016年,阜康市生态环境质量总体呈下降趋势,最近几年以来,阜康市大规模煤矿开采活动危害了区域脆弱生态系统,加剧了土壤污染问题与生态环境恶化。煤矿开采使得大量的重金属通过各种途径进入土壤,对阜康市土壤环境带来了一定的危害[35]。除此之外煤炭开采等活动导致了地表塌陷、水资源污染、水土流失和植被破坏、大气污染以及煤矸石、粉煤灰污染等一系列环境污染问题[36],威胁阜康市的可持续发展。根据近期报告,阜康市全市涉及危险废物的单位有20多家,其中危险废物产生单位有21家,危险废物经营单位4家[37],为此2013年自治区环保厅对阜康市存在的环境问题进行了挂牌督办[38]。由此看出,阜康市的整体环境变化研究结果与实际情况一致。阜康市本身就属于生态环境脆弱区域,对该市的生态环境保护制度进行加强和利用合理的治理措施是减轻生态环境压力的重要出发点。
阜康市作为新疆传统的绿洲农业耕作区,拥有较好的光、热、水、土等自然条件。但是在加速推进工业化和城乡一体化的进程中,建设用地需求的不断增加导致耕地数量不断减少,耕地质量的降低也直接影响耕地的产能和区域粮食产量。目前,新疆自治区地方政府已经制定了一系列优惠政策鼓励差别化开发利用有条件的国有未利用地,这为新疆广泛的未利用地资源的开发利用提供了必要的政策支持。政府政策支持下阜康市很多未利用地转换为耕地,随着耕地面积的扩大,大量未利用土地被开发为耕地和城乡工矿居民地,使未利用土地内部出现了大量其他景观类型,破坏了未利用土地原来的整体性。这也是该城市生态环境质量下降的另一个重要原因。