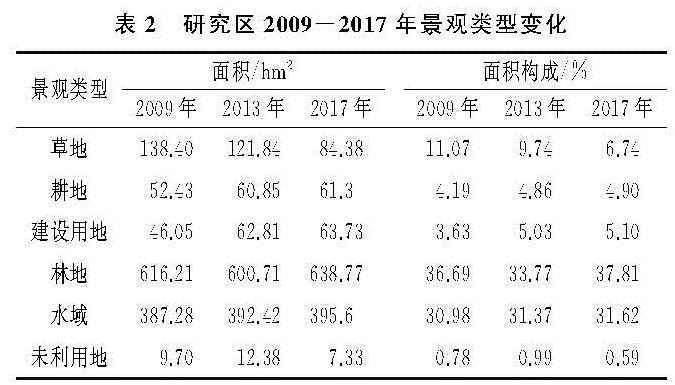
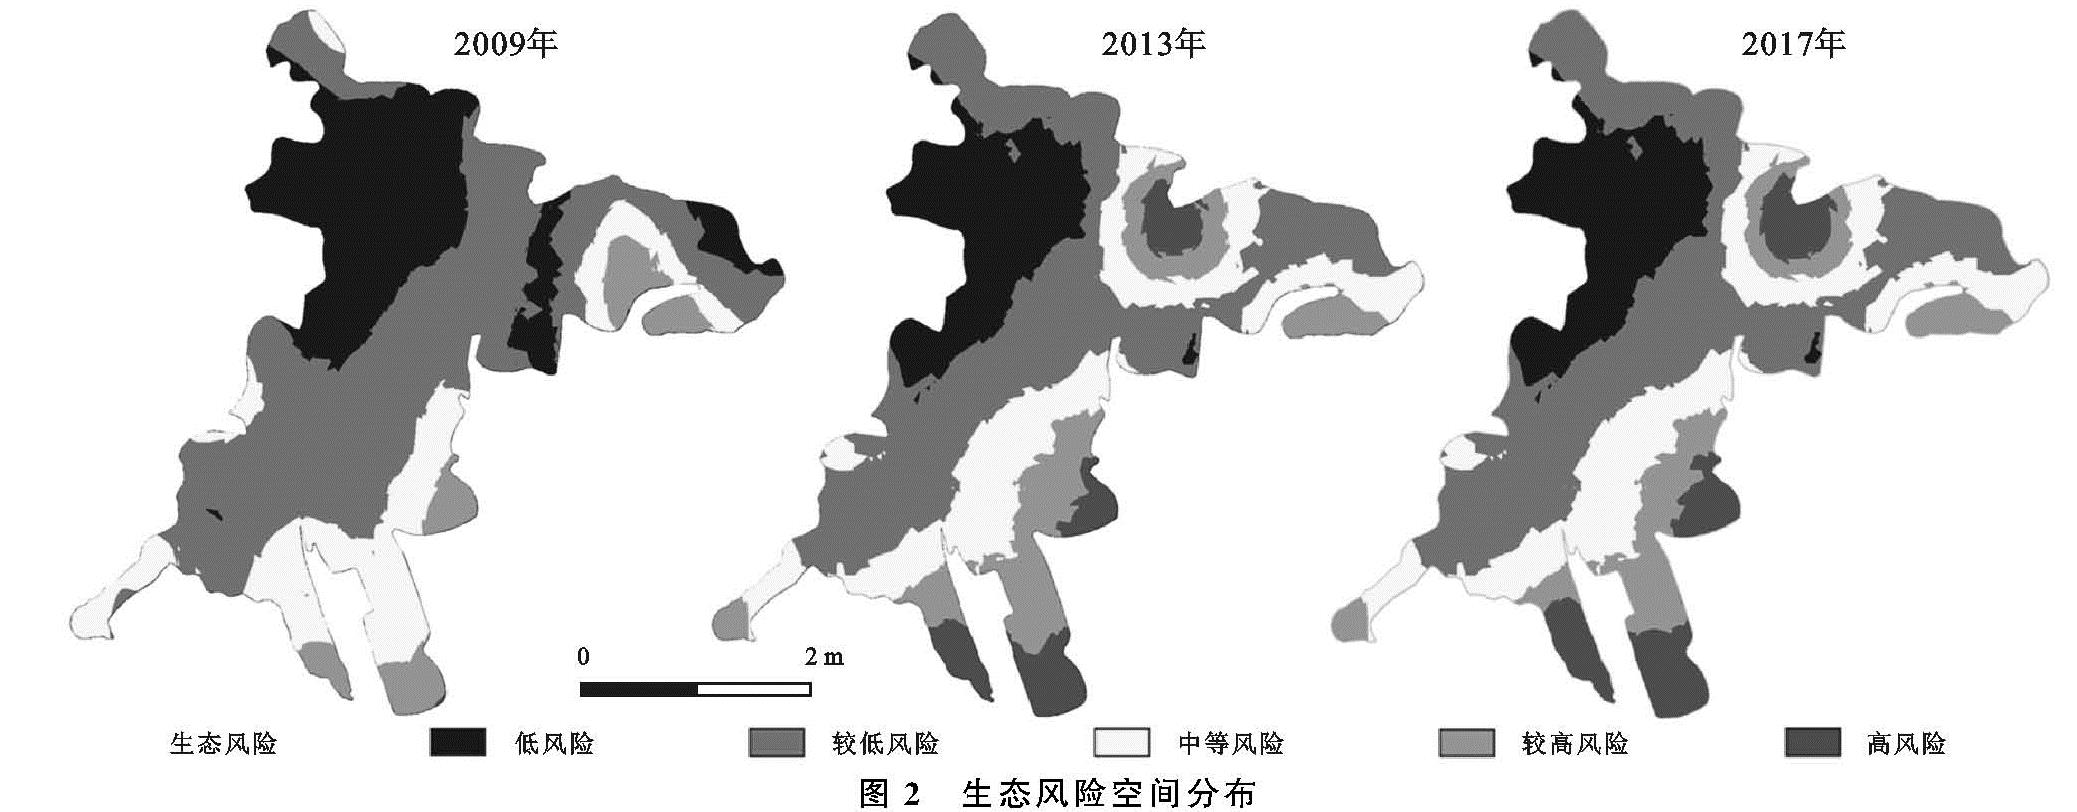
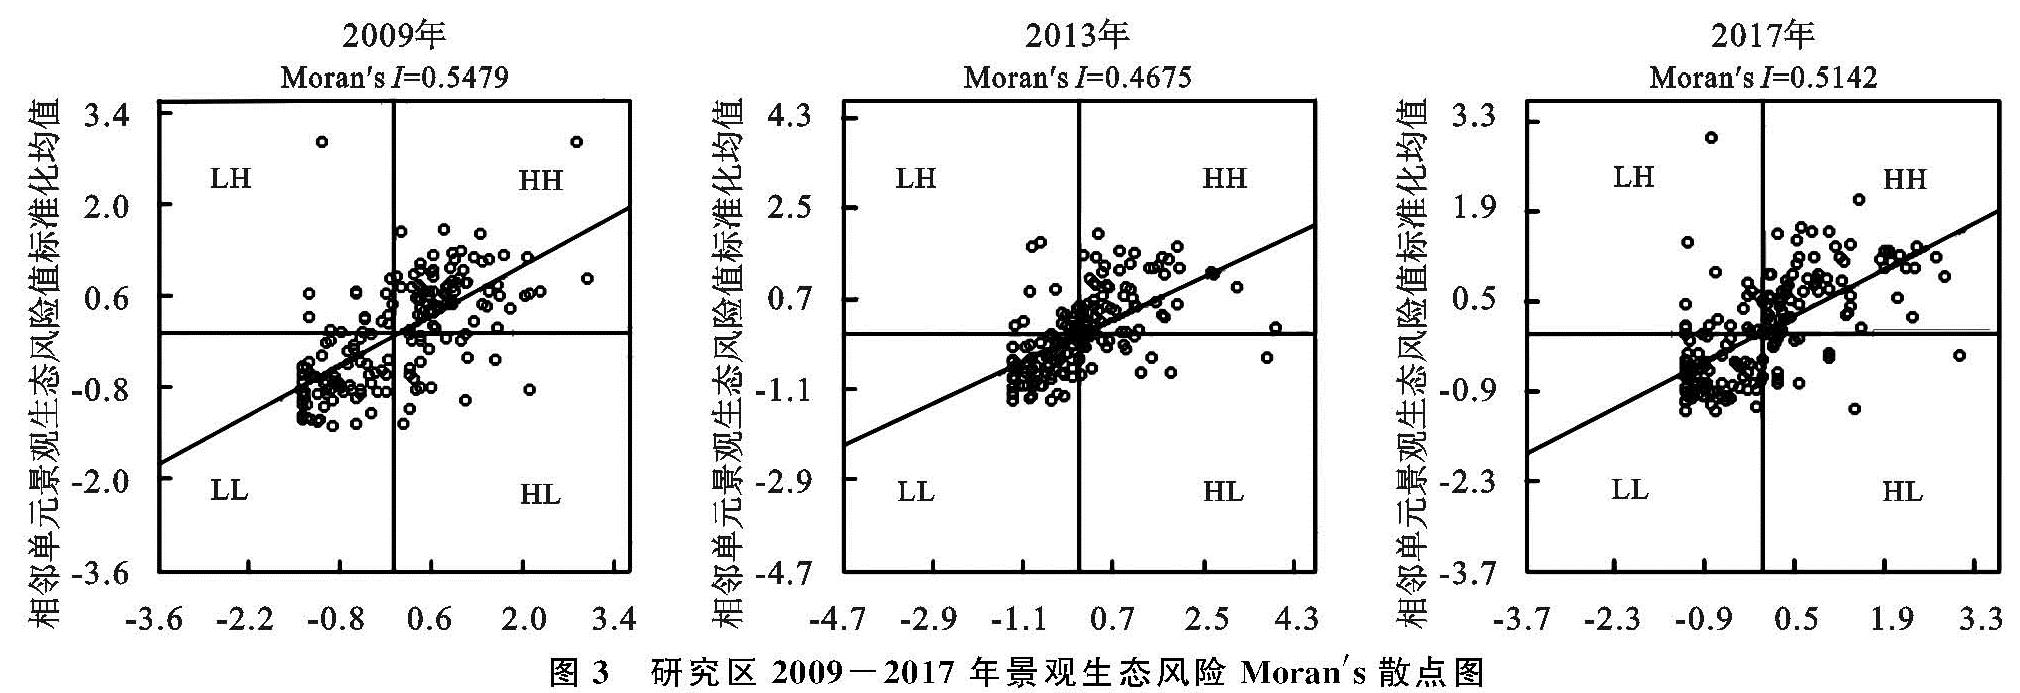
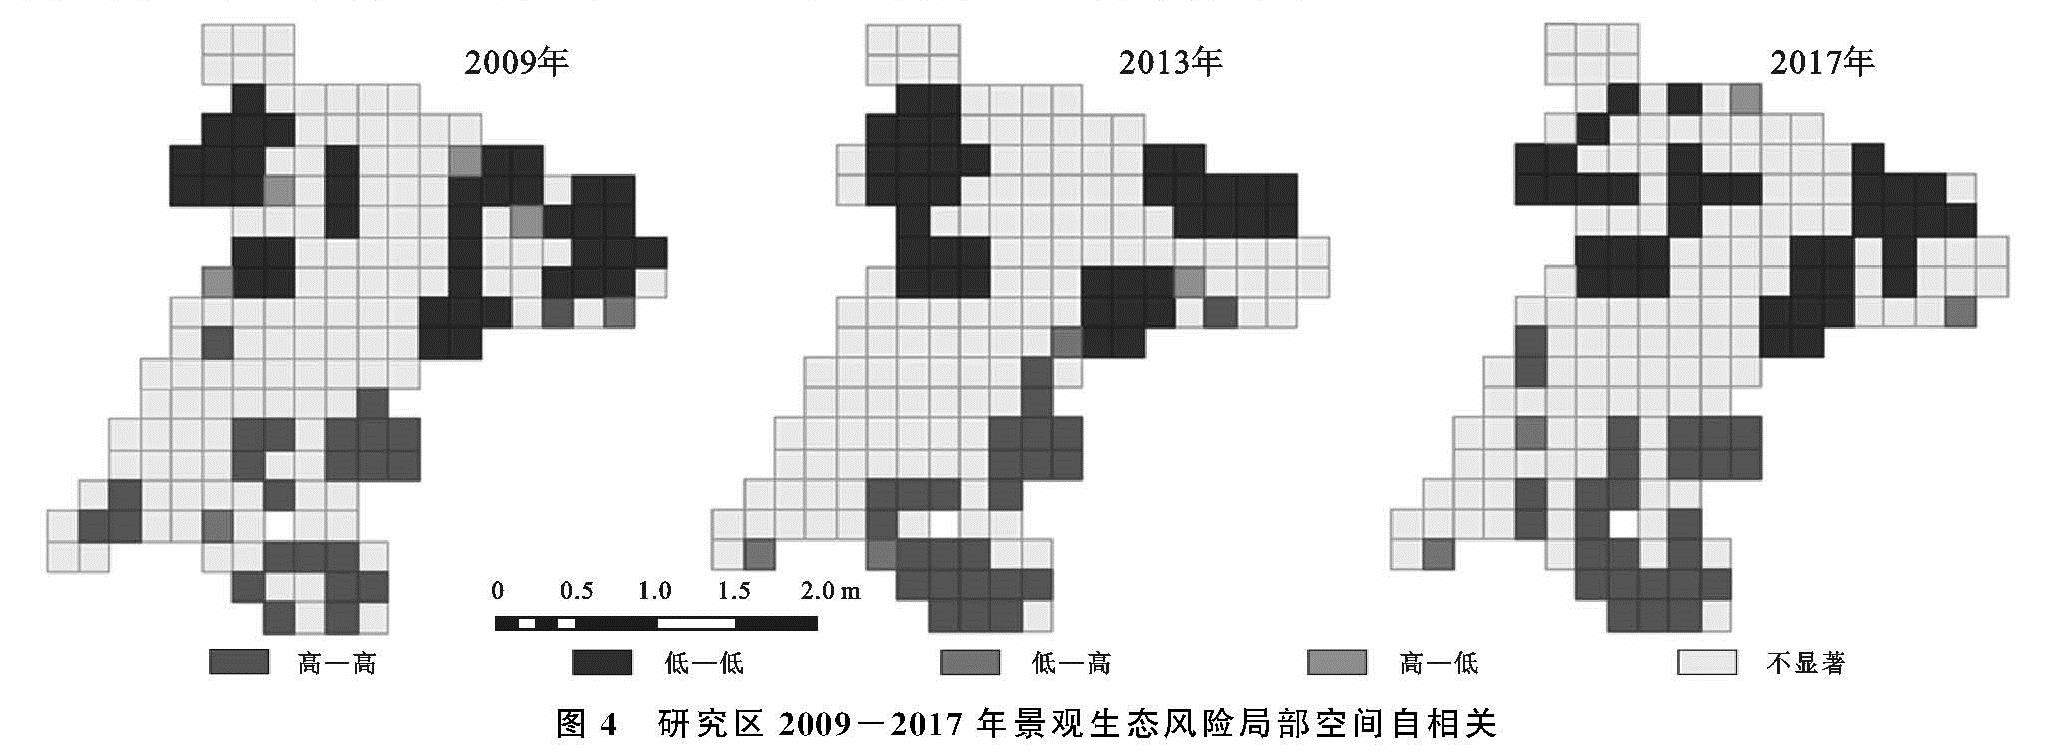
基于景观格局的阿哈湖国家湿地公园景观生态风险评价

(1.贵州大学 林学院, 贵阳 550025; 2.贵州大学 生命科学学院, 贵阳 550025)

景观格局; 景观生态风险; 空间自相关; 阿哈湖国家湿地公园

Assessment on Ecological Risk of Aha Lake National Wetland Park Based on Landscape Pattern
LOU Ni1, WANG Zhijie2, HE Songtao1

(1.College of Forestry, Guizhou University, Guiyang 550025, China; 2.College of Life Science, Guizhou University, Guiyang 550025, China)

landscape pattern; landscape ecological risk; spatial autocorrelation; Aha Lake National Wetland Park

备注

为揭示喀斯特地区城市湿地公园生态风险变化规律及为科学管理阿哈湖国家湿地公园提供理论依据,利用阿哈湖国家湿地公园2009年、2013年、2017年遥感影像,基于景观格局指数构建生态风险评价模型,采用空间自相关方法,分析了2009—2017年阿哈湖国家湿地公园景观生态风险时空变化特征和空间相关性。结果 表明:2009—2017年,研究区内主要景观类型为林地和水域,不同景观类型的面积均发生明显变化,林地面积增加22.55 hm2,建设用地面积增加17.63 hm2,增幅较大,草地面积减少54.02 hm2; 研究区总体景观生态风险呈现上升趋势,高风险区和较高风险区面积分别增加61.12 hm2,112.11 hm2,主要集中在研究区北部和南部,较低风险区、低风险区和中风险区域面积减少,低风险区和较低风险区面积分别减少100.73 hm2,108.80 hm2,主要集中在研究区西北部和西南部; 各时期景观生态风险度的Moran's I值分别为0.352 9,0.498 0,0.480 1,表现出正空间相关性,空间上趋于聚集。人类活动干扰是导致该区域景观生态风险升高的主要原因。

In order to study the ecological risk change of urban wetland parks in karst area and provide the scientific management of the Aha Lake National Wetland Park, three images for 2009, 2013 and 2017 were obtained, an ecological risk assessment model was constructed through landscape pattern index, and spatial correlation were used to analyze the space-time distribution and evolution regularity of the ecological risk in Aha Lake National Wetland Park. The results showed that, in 2009—2017, the main landscape types of Aha Lake National Wetland Park were forestland and water area, the landscape types had changed, the woodland increased by 22.55 hm2, the increment of construction land was larger, and increased by 17.68 hm2, the grassland area decreased by 54.02 hm2; the areas of high risk and higher risk increased by 61.12 hm2 and 112.11 hm2, respectively, mainly concentrated in the southwest and southeast of the study area; the area of the low risk and lower risk and middle risk areas decreased, and the area of the low risk and lower risk areas decreased by 100.73 hm2 and 108.80 hm2, respectively, mainly concentrated in the northwest and east of the study area. Moran's I values of ecological risk degrees of landscape in each period were 0.352 9,0.498 0,0.480 1, presented a positive spatial correlation and tended to gather in space. Interference of human activity was the main reason contributing to the rise of ecological risk.